TGViewer
Channel Public Channel
Metals Wire

Metals Wire

@metalswire

Global Metals&Mining Research from Glush&Team. No investment advice, just numbers & charts!
Subscribers
693
Photos
2.7K
Videos
1
Links
1.9K

Showing posts older than #2671 · Back to latest

Older Posts 16 shown
Post #2669 115
Morning Bites

🔗China’s net finished steel exports rose 7% YoY in August, accelerating from the 3% YoY gain in July. On a 8mo26 basis, net exports were still down 3% YoY. Although China aims to further reduce “excessive” steel output in 2026 (which was also 4% lower YoY in 2025), net exports remain at historical highs (after the 25% and 8% YoY growth in 2024 and 2025, respectively). The current five-year plan lacks explicit targets for capacity cuts; however, we believe that further gradual supply-side measures could help rebalance the market and support steel prices

🪨China’s coal imports dropped 2% YoY in August, vs. 21% increase in July. The decline was partly driven by elevated coal prices and a high base from August 2025, while import volumes remained elevated compared to historical levels

#coal #steel
Post #2668 109
🗞Today, China published its preliminary import/export statistics for August (see table above)

#statistics #China
Post #2667 120
Morning Bites

🔗CISA mills daily crude steel production in late-August fell to 1.885mnt, down 4.1% from the previous ten days, and 3.2% lower YoY. Per CISA data, local production has declined 5.4% YTD (through 31 August). Meanwhile, local steel inventories dropped 11.3% over the period, though remained 8.5% higher YoY

Given the ongoing weakness in the global steel market, we believe that Beijing will continue to gradually tighten supply. Although the current five-year plan lacks explicit targets for capacity cuts, China could potentially introduce additional strict supply-control measures, similar to the 2016-17 reform (when >100mnt steelmaking capacity was removed). Such measures would likely accelerate market rebalancing relative to a scenario of gradual production cuts

For instance, Beijing has recently imposed a more stringent steel capacity swap plan to curb oversupply. Per a Ministry of Industry and Information Technology statement, at least 1.5t of old steel capacity must now be decommissioned to build ⁠every 1.0t of new capacity nationwide

#steel
Post #2666 143
Morning Bites

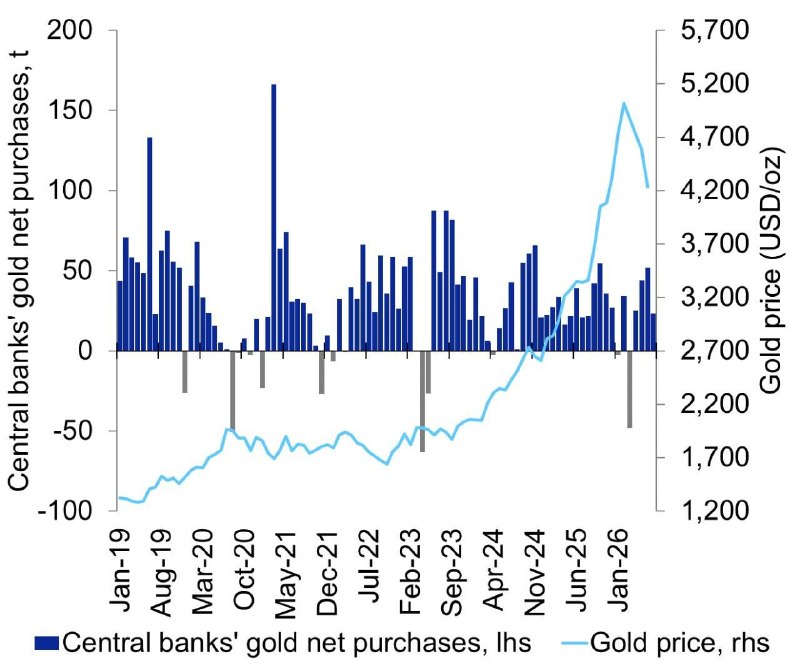
🏦Global central banks purchased 23t (net) of gold in July, vs. the revised 52t (net) in June, according to World Gold Council data. The major buyers in July were China (+20t) and Poland (+8t), which outweighed sales by Russia (-6t) and Turkey (-1t)

Although, at spot, gold continues to trade far above what we see as its cost support level (the 90%-ile AISC was ~USD 2,600/oz in 2Q26, on our numbers), we expect the precious metal’s price to remain elevated in 2026. Furthermore, a recent WGC survey indicates that a record 45% of global central banks plan to increase their gold reserves over the next 12 months

#gold
Post #2665 127
Morning Bites

💍Hong Kong jewellery and watch sales grew 20% YoY in July, matching the pace of growth reported in June, per government data. Rapaport attributed the strength in local sales to continued economic expansion, rising household incomes and stable labor-market conditions, which have helped to sustain consumer confidence

However, we remain cautious on the prospects for a broader recovery in the global diamond market in 2026. The pending sale or spinoff of De Beers by Anglo American leaves the company’s future strategy and approach to supply discipline uncertain until the transaction is completed. A sustained market recovery is therefore unlikely before the ownership situation is resolved, while restoring market discipline and pricing power could take several years

#diamonds
Post #2664 122
Morning Bites

🌏 Global manufacturing PMIs showed mixed dynamics in August. The Eurozone Markit Manufacturing PMI rose to 52.7 (vs. 51.9 in July), while the US ISM Manufacturing PMI declined to 54.6 (vs. 55.6 earlier), primarily due to a slowdown in new orders and weaker employment growth

🇨🇳 The official NBS Manufacturing PMI in China increased to 49.8 (from 49.2 a month ago). The Caixin China Manufacturing PMI also improved to 51.5 (vs. 50.9 earlier)

🇮🇳 India’s manufacturing PMI was at 52.8 (down from 53.5 a month ago), as output and new orders expanded at their slowest pace since August 2021 amid softer demand and challenging market conditions. Manufacturing employment also declined for the first time in two-and-a-half years

❗️Overall, manufacturing PMI readings in western economies remained above 50.0, which could be a positive sign for local industrial metals demand, if the trend persists, we think. At the same time, Chinese PMIs improved in August, although the official NBS index remained below 50.0. Meanwhile, the United States remains the standout with robust PMI figures

#PMIs
Post #2663 118
Morning Bites (part 2)

🇨🇱Chile’s copper output decreased 9% YoY in July, vs. the 5% YoY increase in June, per the INE data. The drop in output was primarily due to severe snowfalls and adverse weather conditions in northern Chile, which disrupted mining and processing activities. The impact was compounded by scheduled maintenance at major operations, while longer term production remains constrained by declining ore grades and broader operational challenges. In 7mo26, output was still down 7% YoY

Considering the negative dynamics in Chilean production (~24% of global mined Cu supply), Cochilco has revised its 2026 output forecast down to 5.3mnt (-2% YoY), from 5.6mnt previously (+4% YoY). Its 2027 supply outlook has also been reduced 8%, to 5.5mnt. Given the production dynamics, we think this new guidance is overly upbeat and see room for some underperformance

We maintain our bullish view on copper, amid both short- and long-term supply issues, growing global demand for renewables and surging investments in China’s grid infrastructure (~8% of global Cu demand, on our numbers)

#copper
Post #2662 124
Morning Bites (part 1)

🥈Global ETFs bought 14mnoz net of silver in August, following the inflow of 5mnoz net in July, per funds data. The net purchase accounted for ~15% of global Ag demand in 2025, in annualised terms, which underpinned the elevated price volatility. Overall, in 8mo26, global ETFs sold 64mnoz net (8% of global Ag demand in annualised terms)

In our view, solid demand for renewable energy in China will further support the silver market, where the physical deficit reached 4% of global Ag consumption in 2025. In the medium-term, we see ~USD 65/oz as a fundamentally reasonable level, but concede that high volatility in Ag prices mainly due to abnormal speculative activity

#silver
Post #2660 115
Morning Bites

📈China’s output of aluminium products rose 1.5% YoY in July, at 5.6mnt, following flat YoY growth in June. In 7mo26, output was broadly unchanged YoY. Nevertheless, it is our view that the rapid expansion of the electricity grid and the new energy sector in China (which accounts for ~60% of global consumption), combined with the country’s Al output cap, remain among the key factors driving aluminium market fundamentals in the medium term

🥉China's output of copper products declined 4.5% YoY in July to 2.1mnt, following the 2.3% YoY decrease in June. 7mo26 production rose 2.4% YoY. We maintain our bullish view on copper, supported by persistent supply-side constraints, including limited mine supply growth, declining ore grades and operational disruptions, along with growing grid investment in China and strong global demand. China accounts for approximately 55% of global Cu demand

#aluminium #copper
Post #2659 137
Morning Bites

🏭 EMAL has restored 25% of reduction cells at its damaged 1.5mnt aluminium plant, which was shutdown in late March, the company has said in a press-release. Management expects to repair all critical equipment and return to full hot metal production in 1Q27. As for now, 1.1mntpa of capacity (~1.5% of global primary Al output) is yet to be restored

We remind readers that ~60% of the region's Al operations were affected to various extents during the Middle East conflict (including UAE’s EMAL, Bahrain’s Alba, and Qatar’s Qatalum). Given the sluggish supply recovery, we anticipate soft production dynamics in the region to persist at least until the end-2026. We expect the global aluminium market to remain in a deficit of ~3% of demand in 2026F, supporting tight market balances

We maintain our view that strong consumption dynamics in Asia (including grid), combined with concerns over global supply, are likely to further support the Al price, which we forecast to average USD ~3,400/t in 2026F

#aluminium
Post #2658 127
Morning Bites

🔗CISA mills daily crude steel production in mid-August was 1.965mnt, down 0.4% from the previous ten days, and 7.1% lower YoY. Per CISA data, local production has declined 5.5% YTD (through 20 August). However, local steel inventories increased 6.7% over the period, and were up 17.0% YoY

Given the ongoing weakness in the global steel market, we believe that Beijing will continue to gradually tighten supply. Although the current five-year plan lacks explicit targets for capacity cuts, it is our view that China might also introduce additional strict supply-control measures, similar to the 2016-17 reform (when >100mnt steelmaking capacity was removed)

For instance, Beijing has recently imposed a more stringent steel capacity swap plan to curb oversupply. Per a Ministry of Industry and Information Technology statement, at least 1.5t of old steel capacity must now be decommissioned to build ⁠every 1.0t of new capacity nationwide

#steel
Post #2656 118
Morning Bites

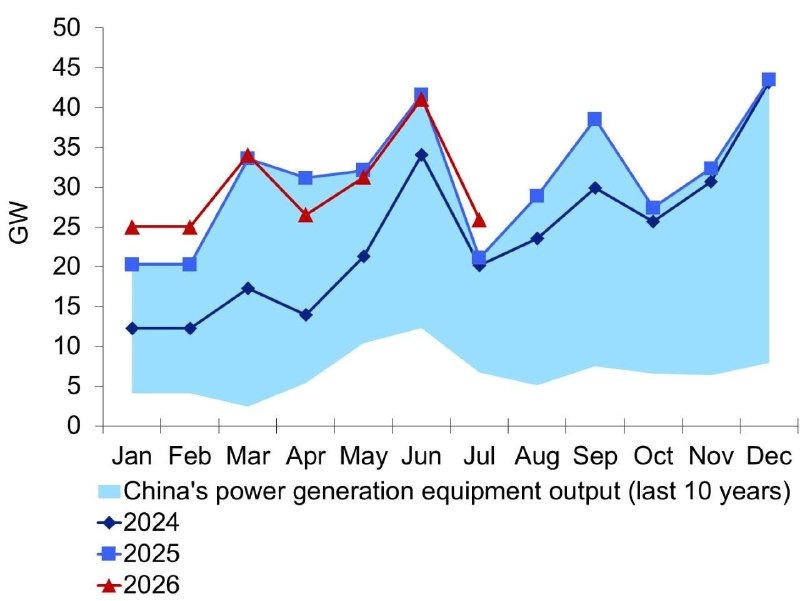
🇨🇳 The output of power generation equipment in China increased 23% YoY in July, after a slight YoY decrease, of 1%, in June, per NBS data. The 7mo26 figure was also up, by 4% YoY

📸 Photovoltaic cell output in China dropped 37% YoY in July, reversing from the +15% YoY in June, mostly due to the high base effect from mid-2025. The local PV cells output also moderately decreased 6% YoY on 7mo26 basis. Despite the negative dynamics seen recently, the overall production trend remains positive: in July 2026, China released a five-year plan for renewable energy, targeting 2.8TW of solar and wind capacity installed by 2030 (vs. 1.8TW as of end-2025)

Given the solid demand for renewable energy in China, we maintain our positive view on silver, copper and aluminium, which are the key beneficiary metals of the proposed global transition to clean energy in 2026-30

#copper #aluminium #silver
Post #2655 128
Morning Bites

🔗Global crude steel output remained broadly flat YoY at 149mnt in July, decelerating from the 2% YoY growth seen in June, according to World Steel Association (WSA) data. China’s production (~54% of global crude steel supply) fell 4% YoY to 77mnt, implying that world ex‑China output grew roughly 4% YoY. Specifically, in July, moderate production gains were recorded in the EU (+4% YoY), US (+4% YoY), Russia (+3% YoY) and India (+2% YoY)

Given the ongoing weakness in the global steel market, we believe that Beijing might continue to tighten supply on a gradual basis. Specifically, in May, China’s Ministry of Industry and Information Technology released a tougher steel capacity swap plan to curb oversupply: now at least 1.5t of old steel capacity needs to exit to build ⁠every 1.0t of new capacity nationwide

#steel
Post #2654 127
Morning Bites

🥉Global mined copper production increased 2.4% YoY in June, vs. the revised drop of 2.3% YoY in May, the ICSG reports. Overall, in 1H26, global copper output decreased 1.0% YoY. The main contributors to the production slowdown were Indonesia and Chile, where mined production declined 32.0% and 6.6% YoY, respectively, affected by major accidents in 2025 and declining ore grades

Meanwhile, global apparent copper consumption increased 2.3% YoY in 1H26, mainly driven by demand in China (+3.2% YoY)

We maintain our bullish view on copper, due to both short- and long-term supply issues, growing global demand for renewables and surging investments in China’s grid infrastructure (~8% of global Cu demand, on our numbers)

#copper
Post #2652 132
Morning Bites

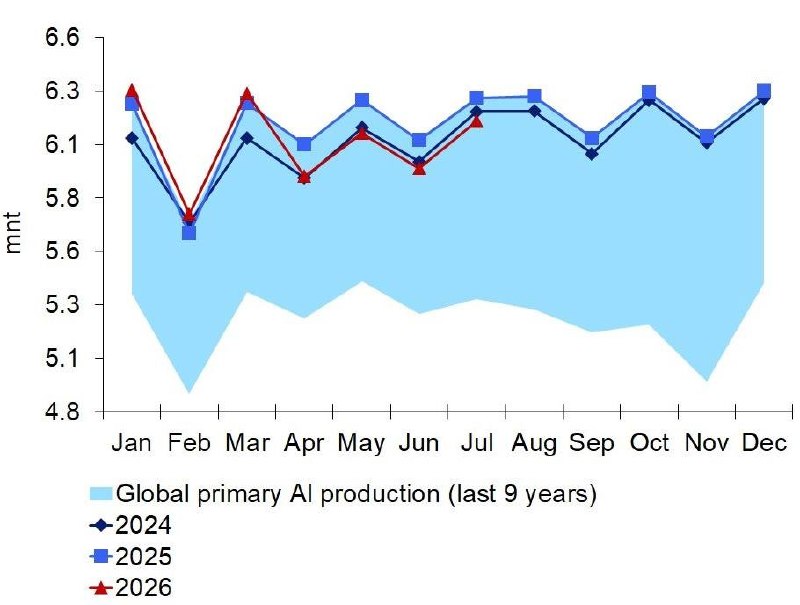
🏭Global primary aluminium output declined 1.7% YoY in July, after the revised drop of 2.1% YoY in June, per IAI data. China's supply (63% of global Al output) grew 2.7% YoY last month. Although local Al output — 45.5mnt annualised in 7mo26 — technically exceeded the cap of 45.0mnt/year (amid utilisation of previously unused quotas, etc), we do not expect the additional volumes to surpass 1.0mnt

Meanwhile, the output of Gulf nations (9% of global Al supply in 2025) shrank 44% YoY in July, amid the US-Iran conflict. Specifically, ~60% of the region's Al operations were affected to various extents since late-February (e.g., UAE’s EMAL, Bahrain’s Alba, and Qatar’s Qatalum). Hence, we anticipate sluggish production dynamics in the region at least until the end-2026

We maintain our view that strong consumption dynamics in Asia (including grid), combined with concerns over global supply, are likely to provide support for the Al price, which we forecast to average USD ~3,400/t in 2026F

#aluminium
Post #2650 122
Morning Bites

🇵🇪 Peru’s copper output fell 5% YoY in June, reversing from the 2% YoY increase in May, per data released by the country’s Energy and Mines Ministry. The decline was mainly driven by lower ore grades at several large operations. On a 1H26 basis, local production was up only 2% YoY, primarily supported by stronger output at Antamina, while lower production at Quellaveco and several other mines limited the overall growth

Meanwhile, the combined copper output of Chile and Peru (~35% of global mined Cu output), was up 2% YoY in June. However, their joint production remained 4% lower YoY in 1H26 amid ongoing supply issues in Chile

We maintain our bullish view on copper, amid both short- and long-term supply issues, growing global demand for renewables and surging investments in China’s grid infrastructure (~8% of global Cu demand, on our numbers)

#copper
Older posts →
Threads Profile ViewerView any public Threads profile without an account.Open ThreadLook →Writing with AI? Make it sound human.Metric37 rewrites AI drafts so they read naturally. Free AI detector, 1,500 words free.Try Metric37 →