TGViewer
Channel Public Channel
World Genetics

World Genetics

@worldgenetics

Learn more about your ancestry
Subscribers
592
Photos
100
Videos
5
Links
55

Showing posts older than #114 · Back to latest

Older Posts 20 shown
Post #113 196
Khoe-San ancestry did not disappear from South Africa’s Coloured communities.

In sampled groups from the Cederberg, Great Karoo and Middle Orange River, the paper reports average Khoe-San ancestry of 41–53%. A wider geographical comparison finds averages rising from about 40% near Cape Town to 80% in the southern Kalahari.

The study adds 620 newly sampled people to a regional dataset of 997. Their Khoe-San DNA shows affinities between Nama and ≠Khomani San references, connecting these communities to southern African population history that predates colonial rule.

Later migrations added further layers. European settlement and the forced movement of enslaved people brought ancestry from Europe, other parts of Africa and Asia. The Southeast Asian component matches Indonesian references, including Java and Sulawesi, with some affinity toward Flores. South Asian ancestry is roughly twice as abundant across the sampled populations, but its precise regional sources remain unresolved.

European segments resemble French and British references; Dutch genomes were unavailable, so the study cannot rank those countries’ actual contributions. Other African ancestry also varies, from about 11% in the Cederberg to 22% in the Karoo and Middle Orange River.

These are model-based estimates and reference affinities, not fixed percentages for every person or literal ethnic ingredients. “Coloured” is a South African community identity used by participants. The cover portrait illustrates the context, not that person’s DNA results.

📚 Source: Edington et al. (2026), Science Advances
Recovering the precolonial population structure of Khoe-San descendant populations

🧬 Curious about your own ancestry?
🌍 Explore your DNA at https://www.worldgenetics.app/
  • ❤ 2
Post #112 219
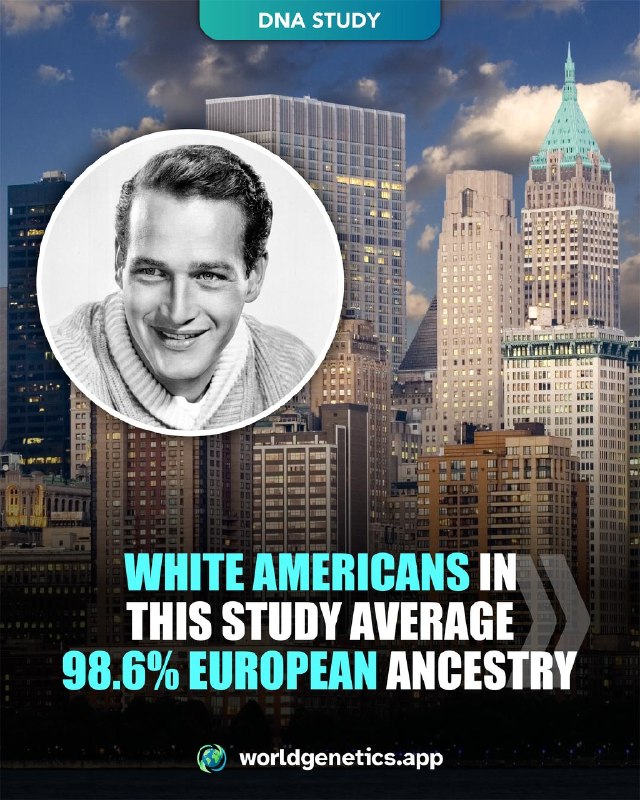
White Americans share broad European roots—but their regional ancestry patterns tell different migration stories.

In this 2015 study, 148,789 self-identified European American 23andMe customers average 98.6% European ancestry. This is a sample average, not a rule for every White American.

British/Irish ancestry averages over 20% in every state analyzed. In Mississippi, Arkansas and Tennessee, it exceeds 50%. The authors suggest that less later immigration from other European regions may help explain the strong Southern signal.

Further north, Scandinavian ancestry reaches 10% or more on average in Minnesota and the Dakotas, while most states show only trace averages. Eastern European ancestry peaks in Illinois, Michigan and Pennsylvania, consistent with immigration into the Midwest and Northeast in the late 1800s and early 1900s.

Smaller Iberian signals also appear in Florida, Louisiana, California and Nevada. Spanish colonial history is one possible explanation, not a genetically proven route.

European ancestry is not the whole story for everyone. In Louisiana, as many as 8% of participants meet a 1% Native American ancestry threshold. About 5% in Louisiana and South Carolina meet a 2% African ancestry threshold. Those are shares of people—not average ancestry percentages.

A simplified model suggests roughly ten times as many female as male Native American ancestral contributions. This is inferred sex bias, not a literal count of ancestors. The authors place the detected non-European mixing mainly in the Americas within the last 500 years relative to the study.

The regional analysis includes 45,783 European Americans with location data. These customers are not a representative census, and the ancestry labels measure reference affinities—not exact national origins or personal identity.

📚 Source: Bryc et al. (2015), The American Journal of Human Genetics
The Genetic Ancestry of African Americans, Latinos, and European Americans across the United States

🧬 Curious about your own ancestry?
🌍 Explore your DNA at https://www.worldgenetics.app/
  • ❤ 4
Post #111 195
In Italy's heel, a Greek language survived—but the community did not stay genetically isolated.

Grecìa Salentina is a group of towns in southern Puglia where Griko, a Greek dialect, has historically been spoken. Were their people mainly descended from ancient Greek settlers, later Byzantine arrivals, or a more complicated history?

A new preprint studies 27 local genomes alongside comparison samples, including 4,021 ancient individuals. Its main result: the community's overall genetic profile broadly matches neighboring Southern Italians.

Some tests do pick up slightly stronger connections to Greece and Anatolia. In one comparison, the samples overlap especially with Sicily and the southeastern Peloponnese. Among Byzantine-era references, western Anatolian groups show some overlap too. These are genetic similarities, not proof of one exact homeland.

The deeper story has many layers: ancestry shaped by early farming and Bronze Age movements, followed by further Mediterranean connections. Ancient comparisons fit a history more complex than descent from one group of colonists. The study cannot put a reliable percentage on ancestry specifically from ancient Greek colonization or Byzantine immigration.

Within Grecìa Salentina, DNA sharing connects different towns. The samples show no excess genetic signs of isolation compared with other Italians. Greek-speaking communities exchanged ancestry with the wider region.

The authors favor a language maintained locally and periodically reinforced by arrivals from the Greek-speaking world. That could preserve a distinctive language without creating a separate genetic island.

This is a small-sample preprint, not yet peer-reviewed. DNA supports patterns of contact; it cannot prove when Griko first arrived or which language a particular ancestor spoke.

📚 Source: Cangialosi et al. (2026), bioRxiv (preprint)
Layered genomic composition and linguistic continuity in Grecìa Salentina

🧬 Curious about your own ancestry?
🌍 Explore your DNA at https://www.worldgenetics.app/
Post #110 191
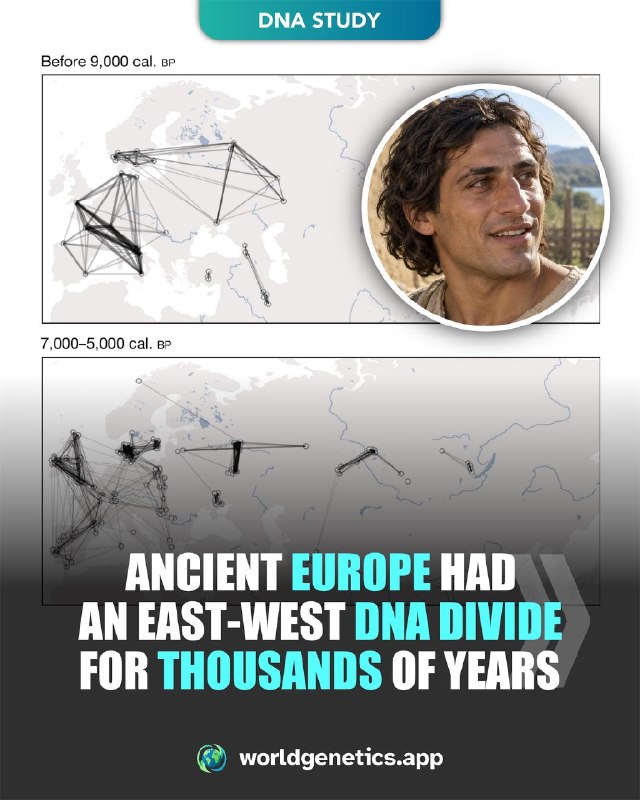
Ancient Europe had a genetic divide running from the Baltic to the Black Sea—and it lasted for millennia.

This study added 317 ancient genomes to a wider dataset of more than 1,600 people, tracing how migrations changed western Eurasia after the Ice Age.

West of the divide, incoming farmers with Anatolian-related ancestry transformed the genetic landscape. East of it, hunting and fishing communities persisted much longer. In the eastern Baltic, Ukraine and western Russia, local hunter-gatherer ancestry remained dominant until around 5,000 years ago, without a noticeable influx of Anatolian farmer ancestry.

But the western story was not uniform replacement. Newly reported early farmer samples from Portugal carry an estimated 27–43% Iberian hunter-gatherer ancestry, pointing to substantial mixing near the arrival of farming.

Then came a second transformation. The paper models Yamnaya-related steppe ancestry as roughly 65% Middle Don hunter-gatherer-related and 35% Caucasus hunter-gatherer-related. The Don reference already contains Caucasus-related ancestry: these are model components, not two separate modern ethnicities.

Groups carrying steppe ancestry mixed with farmers related to the Globular Amphora culture. Their ancestry then spread through Corded Ware and related populations, reaching most of Europe within roughly 1,000 years.

In Denmark and southern Sweden, the two major transitions—from hunters to farmers, then to steppe-related populations—occurred only about 1,000 years apart.

This was a broad genetic boundary, not a wall or a border between “pure” peoples. Ancient samples represent parts of a much larger history; genetic references do not identify exact tribes, languages or migration routes.

📚 Source: Allentoft et al. (2024), Nature
Population genomics of post-glacial western Eurasia

🧬 Curious about your own ancestry?
🌍 Explore your DNA at https://www.worldgenetics.app/
  • ❤ 3
Post #109 212
A cave 4,000 meters up in the Himalayas preserves an unexpected ancestry story: a community with a roughly 50–50 blend related to North Indians and ancient Tibetans.

Researchers recovered DNA from 10 people at Old Lady Spider Cave in Ladakh, northern India. Seven had enough data for the main ancestry analyses. They lived about 1,500 years ago and shared a remarkably similar ancestry profile.

Roughly half their ancestry is related to populations represented today by North Indian groups, including Dogra and several Brahmin reference samples. Those are genetic comparisons—not evidence that the ancient migrants belonged to those modern communities or castes.

The other half is related to ancient Tibetans. The exact source remains unsampled: no available Tibetan reference perfectly matches it. Small extra components in the models do not prove a separate migration from the Bronze Age Tarim Basin.

Their ancestors had mixed much earlier. DNA segment patterns date the event to about 1,343 ± 140 years before these people lived—roughly 2,800 years ago. Contact clearly predates the Tibetan Empire. But the mixing need not have happened in Ladakh; people could have arrived after mixing elsewhere in the Himalayas.

A near-equal blend like this is uncommon in South Asia today, yet the population left a genetic legacy. One model for the Minero of Ladakh estimates 56 ± 1% ancestry represented by Old Ladakh and 44 ± 1% represented by Dogra. That is a model using reference populations, not proof that 56% of their family tree comes from the people in this cave.

The study reveals an ancient connection across the Himalayas—not one ancestry formula for everyone living there today.

📚 Source: Patterson et al. (2026), Science Advances
Ancient genomes from Ladakh reveal 2800-year-old admixture between Tibetans and South Asians

🧬 Curious about your own ancestry?
🌍 Explore your DNA at https://www.worldgenetics.app/
  • 👍 1
Post #108 199
DNA recovered from hair attributed to Thomas Jefferson adds new evidence to a family history long preserved by Sally Hemings’ descendants.

Jefferson, the third US president, enslaved Hemings at Monticello. Her family’s accounts identified him as the father of her children. A new, not yet peer-reviewed preprint compares his reconstructed genome with living descendants of his wife, Martha Wayles Jefferson, and of Hemings’ sons Madison and Eston.

The earlier DNA breakthrough came in 1998: Eston’s male line matched the Jefferson paternal line. That linked the families, but could not distinguish Thomas from other Jefferson men.

The new study uses hair preserved after Jefferson’s death in 1826. Collection history and several genetic checks support its identification. Shared inherited DNA connects the resulting genome to both family branches. One Madison-line descendant shares about 5.1% in the study’s initial analysis; that is one person’s estimated inherited sharing, not an ethnic ancestry percentage or a family-wide average.

The researchers then compare three possible fathers: Thomas, his brother Randolph, and a son of Randolph. For Madison’s branch, one model makes the observed DNA about 513 times more likely under Thomas’s paternity than Randolph’s. This is a likelihood ratio, not an ancestry percentage.

Eston’s branch also favors Thomas, but less strongly: about 5–7 times over Randolph. Under equal starting probabilities for the three tested models, Thomas’s estimated probability is about 99.8% for Madison and 83–87% for Eston. Those results depend on the models and assumptions.

The findings strengthen the case for descent from Jefferson himself. They do not genetically test the paternity of every child Hemings had, and they do not establish ancestry averages for Black or white Americans.

📚 Source: Green et al. (2026), bioRxiv (preprint)
The DNA legacy of Thomas Jefferson

🧬 Curious about your own ancestry?
🌍 Explore your DNA at https://www.worldgenetics.app/
  • 👍 1
Post #107 209
Palau’s ancestry story starts before anyone settled its islands.

A new study analyzes DNA from 21 ancient people at four sites, dating to roughly 2,900–500 years BP. Their ancestry is broadly ~60% East Asian-related and ~40% Papuan-related, similar to present-day Palauans. These are genetic model estimates using reference populations, not literal percentages from modern countries.

The oldest genome places major mixing around 3,880–3,429 BP—earlier than Palau’s first settlement around 3,200–3,000 BP. The founders’ ancestors had already mixed before their voyage. BP means years before 1950; both archaeological dates and genetic estimates have uncertainty.

The Papuan component is closer to mainland New Guinea references than to New Britain or the Solomon Islands. That does not prove that New Guinea Highlanders themselves sailed directly to Palau.

A clue comes from 2,100-year-old people on Morotai in eastern Indonesia. They share Palau’s distinctive combination of ancestry, though their proportions differ: about 70% East Asian-related and 30% Papuan-related. Northern Wallacea is a plausible source region, but these younger Morotai samples are not the literal founders, and the exact departure point remains unknown.

Papuan ancestry entered primarily through male ancestors, although maternal lineages show that women contributed too.

Palau then retained a broadly similar ancestry mix for nearly 3,000 years—the longest such continuity yet documented by ancient DNA in Remote Oceania, according to the authors. This is continuity, not complete isolation: later samples show slightly more East Asian ancestry, consistent with additional arrivals.

The result links ancient islanders with Palauans today while showing that the Pacific was peopled through more than one migration history.

📚 Source: Liu et al. (2026), Cell
Papuan admixture predated the settlement of Palau

🧬 Curious about your own ancestry?
🌍 Explore your DNA at https://www.worldgenetics.app/
  • ❤ 2
  • 👍 1
Post #106 191
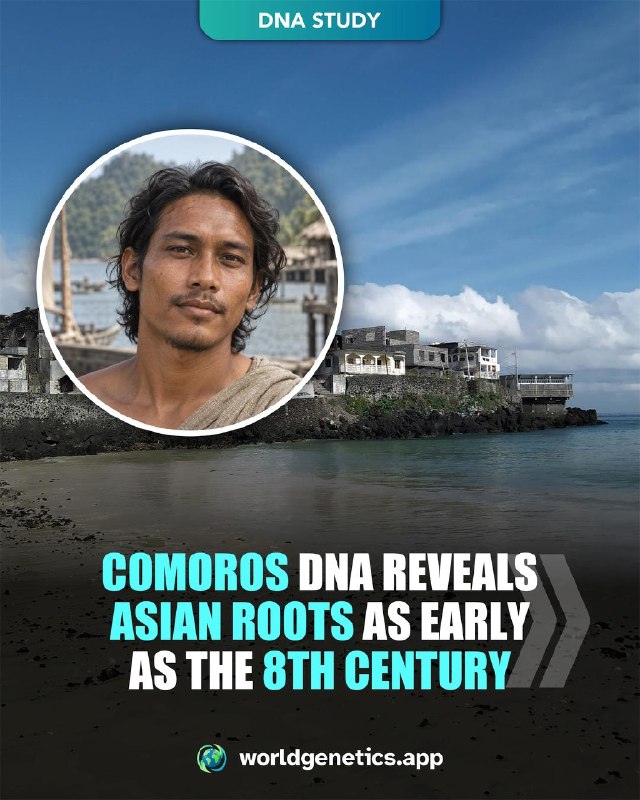
The Comoros sit between East Africa and Madagascar—but part of their ancestry points thousands of kilometres farther east. 🌊

This 2018 study of modern DNA inferred African–Southeast Asian mixing on Anjouan as early as the 8th century. The earliest signal detected in its Madagascar comparisons was later, in the late 11th century.

Most Comorian ancestry connected to African populations along the Swahili coast. The Southeast Asian side was best represented by present-day Banjar from Borneo and Malay references.

One historical mixture model estimated 17–20% Southeast Asian contributions in Comorian groups, versus 33–37% in the Malagasy groups studied. These are model estimates using genetic proxies—not literal percentages of named medieval peoples. A separate clustering analysis gave Comorians 8–9% Island Southeast Asian affinity; the two measures are not interchangeable.

Later contacts added another layer. The authors linked Middle Eastern input on Anjouan to around the 1400s, with a stronger contribution through men. Moheli also showed evidence consistent with renewed migration from Madagascar in the 1800s.

Shared roots did not mean identical histories: Comorian is a Bantu language, while Malagasy belongs to the Austronesian family.

The dates estimate mixing, not first landfall. Missing northern Madagascar data means this cannot prove which island migrants reached first—or a single route connecting them. Historical people shown are AI illustrations, not identified ancestors.

Photos, cropped/overlaid: R. Botev, Ahmedshayo14, GeGki (CC BY-SA 4.0); Anandajoti (CC BY-SA 3.0); alKomor.com, Woodlouse (CC BY-SA 2.0); V. Guillot (CC BY 2.0); J. Kulp/US Navy (PD). Full asset links and credits accompany the files.

📚 Source: Brucato et al. (2018), The American Journal of Human Genetics
The Comoros Show the Earliest Austronesian Gene Flow into the Swahili Corridor

🧬 Curious about your own ancestry?
🌍 Explore your DNA at https://www.worldgenetics.app/
  • 👍 2
Post #105 218
In a São Paulo study, 67% of self-identified White participants have an African ancestry estimate above zero. But that is a count of people—not 67% of their DNA. The entire White group's median African estimate is 7.4%.

This distinction opens up the real story: color categories and family history overlap, but they do not match person for person.

Researchers genotyped 841 residents and used 720 unrelated participants for the main comparisons. Across those 720, 80.3% have more than 50% estimated European ancestry.

The self-identified Mixed/Parda group is not defined by an even split between Africa and Europe. Its separate medians are 62.3% European, 26.5% African and 8.5% Indigenous American. Separate medians need not total 100%.

Among Black/Preta participants, the balance shifts: African ancestry has a median of 56.1%. Yet 14 of 74 people in this group—nearly one in five—have European estimates above 50%.

Indigenous American contributions also extend across the three largest groups, with medians of 3.6% in White, 8.5% in Mixed and 5.6% in Black participants.

Behind the overlap lie centuries of colonization, slavery, migration and mixing. The study does not identify exact migration routes or specific ancestral peoples. These are broad, reference-based estimates from a São Paulo city sample; small values depend on the model and references.

The labels relate to ancestry at group level, but cannot tell someone's whole ancestry story or determine their identity. The cover's Rodrigo Santoro portrait is contextual; his personal DNA is not reported here.

Which finding surprised you most?

📚 Source: Pereira et al. (2024), Genes
Genetic Ancestry and Self-Reported “Skin Color/Race” in the Urban Admixed Population of São Paulo City, Brazil

🧬 Curious about your own ancestry?
🌍 Explore your DNA at https://www.worldgenetics.app/
  • 👍 4
Post #104 220
African ancestry reaches beyond a single American identity.

A 2015 study of 23andMe customers finds it across self-identified African Americans, Latinos and European Americans, in very different amounts. Here, “African” means affinity to sub-Saharan African references, not North African ancestry.

The 5,269 African American participants average 73.2% African ancestry, with the highest levels in the South, especially South Carolina and Georgia. African ancestry rises to 76.9% on the X chromosome, supporting greater African female than male contributions. Slavery and exploitation are essential historical context, though DNA cannot establish the circumstances of individual relationships.

The 8,663 Latino participants average 6.2% African ancestry. Levels are especially high in Louisiana and also elevated in the Midwest and Atlantic states. Participants identifying as Puerto Rican or Dominican average more African ancestry than the Latino sample overall.

Among 148,789 European American participants, at least 1.4% have 2% or more estimated African ancestry. In Louisiana and South Carolina, that share reaches about 5%. These numbers describe how many people cross a threshold, not everyone's average DNA percentage. At the lower 1% cutoff, the share in those two states reaches about 12%.

For the African ancestry detected in European Americans, the authors favor mixing in the Americas within the last 500 years over ancient mixing in Europe. The timing comes from demographic models, not a dated ancestor in every family tree.

These are reference-based estimates from a customer sample, not a representative census. Genetic ancestry does not determine identity.

📚 Source: Bryc et al. (2015), The American Journal of Human Genetics
The Genetic Ancestry of African Americans, Latinos, and European Americans across the United States

🧬 Curious about your own ancestry?
🌍 Explore your DNA at https://www.worldgenetics.app/
  • 🌭 1
Post #103 216
India’s ancestry story brings together ancient South Asian hunter-gatherers, people related to early farmers, and Bronze Age steppe herders. But the balance varies enormously.

A study of 2,679 quality-checked Indian genomes explores that history, from a major expansion out of Africa around 50,000 years ago to later migrations and marriage patterns.

Among 2,126 people in its main three-way ancestry analysis, estimates range from roughly 19–69% ancient South Asian hunter-gatherer-related, 27–68% Iranian farmer-related and 0–45% steppe-related ancestry. These are individual model ranges, not national averages or three percentages describing one person.

One striking finding: the best tested proxy for the farmer-related component is ancient Sarazm, in present-day Tajikistan. Those reference individuals lived around 3600–3500 BCE. A close genetic match does not prove that Sarazm itself was the migration source.

The hunter-gatherer-related contribution is generally higher in southern India. East and Northeast India add other histories: a sampled West Bengal group has about 5% East Asian-related ancestry, with mixing estimated around 50 generations ago.

Later marriage within communities and population founder events helped preserve differences. India therefore cannot be reduced to one ancestry recipe—or three rigid ethnic groups.

An even older legacy survives too: the sample averages about 1.43% Neanderthal and 0.10% Denisovan ancestry.

These estimates depend on the available reference populations. The cohort mainly includes older adults and cannot represent every Indian community equally. The cover portrait is contextual; Alia Bhatt’s DNA is not analyzed here.

Which part of India’s ancestry story surprised you most?

📚 Source: Kerdoncuff et al. (2025), Cell
50,000 years of evolutionary history of India: Impact on health and disease variation

🧬 Curious about your own ancestry?
🌍 Explore your DNA at https://www.worldgenetics.app/
  • ❤ 1
Post #102 212
People across Asia and Oceania carry DNA from at least three different Denisovan populations. A 200,000-year-old man from Siberia helps reveal how those ancient encounters shaped living people.

His DNA comes from a molar found at Denisova Cave in the Altai Mountains. The genome suggests a small community of roughly 50–60 people, with about one newcomer per generation. These are demographic model estimates, not a counted settlement.

He was also mixed: an estimated 3.6–5.2% of his DNA came from Neanderthals. Later Denisovans at the cave belonged to a different population and carried a different history of Neanderthal mixing. The evidence points to local population turnover, not the disappearance of all Denisovans.

The modern legacy is even more surprising. South Asians and Oceanians share ancestry from a Denisovan branch more distant than the two high-quality Siberian genomes. Yet the DNA-segment patterns suggest their ancestors inherited that contribution through separate encounters.

The authors propose that an early wave of modern humans passed through South Asia toward Oceania, followed by ancestors of present-day South Asians. East Asians lack the same deeply divergent component in this analysis and show stronger connections to a northern Denisovan branch, suggesting a possible northern arrival route.

Estimated Denisovan mixing dates are roughly 50,000–39,000 years ago for South Asians and 44,000–35,000 for East Asians. They cannot be assigned neatly to each separate Denisovan component.

Small Denisovan traces even appear in Europeans, probably passed on through contact with Asian populations rather than local encounters with Denisovans.

This is a preprint. The routes and ancient contact zones remain hypotheses, and “three groups” describes contributions across populations—not three equal ancestry blocks in everyone.

📚 Source: Peyrégne et al. (2025), bioRxiv (preprint)
A high-coverage genome from a 200,000-year-old Denisovan

🧬 Curious about your own ancestry?
🌍 Explore your DNA at https://www.worldgenetics.app/
  • ❤ 3
  • 👍 1
  • 🤩 1
Post #101 222
Mexico City's ancestry story goes far beyond a simple European–Indigenous mix.

In 138,511 participants from Coyoacán and Iztapalapa, researchers estimated an average of 66% Indigenous Mexican, 31.1% European and 2.9% African ancestry. These are results for this two-district sample, not a national Mexican average.

The Indigenous component was strongly regional: central Mexican references accounted for 35.6% of total ancestry, southern references 15.9%, and southeastern references 11.8%. Northern and northwestern references contributed 1.6% and 1.1%. These are model estimates of genetic similarity to reference groups—not exact percentages from named ethnic peoples such as the Aztecs or Maya.

The DNA also carries a sex-biased history. Indigenous ancestry was higher on the X chromosome than on the autosomes, consistent with more Indigenous female and European male contributions to the ancestral mixture. A simplified model estimated that women accounted for 71.3% of the Indigenous contribution but 7.5% of the European contribution. Those are modeled historical contributions, not percentages of today's men or women.

Later migration helped shape the city again. The paper describes major arrivals from central, southern and southeastern Mexico during the 1950s–1970s, especially into Iztapalapa. Participants in neighboring Coyoacán had more European ancestry on average.

Among 3,595 inferred parent couples, partners' ancestry was correlated. That does not tell us why they paired up. And throughout the cohort, ancestry varied widely from person to person: one city average could never describe everyone.

📚 Source: Ziyatdinov et al. (2023), Nature
Genotyping, sequencing and analysis of 140,000 adults from Mexico City

🧬 Curious about your own ancestry?
🌍 Explore your DNA at https://www.worldgenetics.app/
  • ❤ 1
Post #100 249
Roman rule changed the Balkans. Later migrations helped shape the ancestry of the people living there today.

A 2023 ancient-DNA study traced this story across the first millennium AD, reporting 136 new ancient Balkan genomes.

Under early Roman rule, many sampled people retained ancestry similar to earlier local Balkan populations. There was little detectable input related to pre-Imperial Italian populations—but substantial migration from the empire's east. About one-third of 45 early Roman individuals had predominantly western Anatolian or, in one case, northern Levantine ancestry.

From roughly AD 250–550, newcomers brought Central/Northern European and steppe-related ancestry, often already mixed. Then, by around AD 700, a much larger Eastern European-related signal appeared across the sampled regions, associated with Slavic migrations that had begun earlier.

Women moved too. At Nuštar in Croatia, a mother had about 90% Eastern European-related ancestry and her son 64%, pointing to a father with a more mixed background.

That migration left a lasting legacy. The study's models estimated roughly 50–60% Eastern European-related ancestry in sampled Serbs, Croats, Bulgarians and Romanians; 30–40% in mainland Greek groups; and 4–20% in sampled Aegean island groups. Earlier Balkan and Roman-era Anatolian roots also survived.

These are model estimates using ancient reference groups, not literal percentages of a fixed “Slavic ethnicity.” DNA does not establish which language a person spoke. Urban burial sites are overrepresented, and sparse sixth-century samples leave the earliest migration phases less clear.

📚 Source: Olalde et al. (2023), Cell
A genetic history of the Balkans from Roman frontier to Slavic migrations

🧬 Curious about your own ancestry?
🌍 Explore your DNA at https://www.worldgenetics.app/
  • ❤ 1
Post #99 245
Brazil shares a history of Indigenous peoples, European migration and Africans brought through slavery. But the balance looks very different from one region to another.

A 2019 review combines 51 studies covering 81 populations across 19 states. Its sample-weighted averages are 68.1% European, 19.6% African and 11.6% Indigenous American ancestry.

In the South, the European estimate reaches 81.8%. Portuguese colonization and later immigration from Europe helped shape this pattern. The southern sample is overwhelmingly from Rio Grande do Sul, so it cannot represent every southern community equally.

The Northeast has the highest African average: 35.2%. Even within that region, the reported estimates differ sharply: 43.2% in Bahia versus 18.7% in Ceará. Their distinct histories of slavery, settlement and mixing matter; neither figure describes every resident.

Further north, Indigenous ancestry reaches a regional average of 27.7%, the highest in the review. The legacy of Brazil's first peoples remains part of many families beyond Indigenous communities themselves.

Local histories add another layer. Quilombos include communities formed by people escaping slavery. In 15 studies of Afro-descendant communities, analysed separately, African estimates range from 26% to 89%. A shared community label does not imply one genetic profile.

These are estimates from varied samples and genetic reference panels, weighted by study sample size—not a census of Brazil. Methods and recruitment affect the numbers, and DNA percentages do not define ethnic identity.

📚 Source: Souza et al. (2019), Genetics and Molecular Biology
A systematic scoping review of the genetic ancestry of the Brazilian population

🧬 Curious about your own ancestry?
🌍 Explore your DNA at https://www.worldgenetics.app/
  • 👍 2
Post #98 255
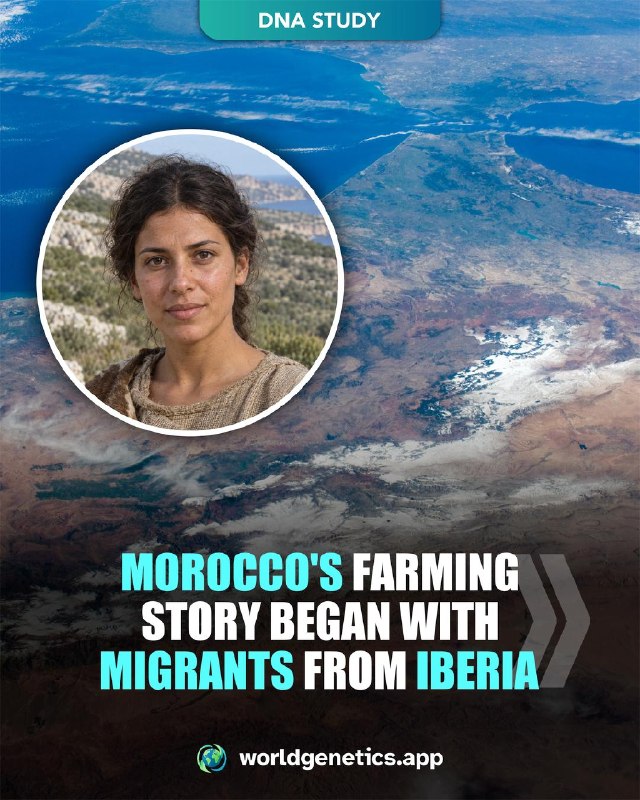
Morocco’s farming story began with people crossing the Mediterranean—and it did not end with one migration.

Ancient DNA from nine newly studied individuals, compared with earlier genomes, reveals a local Maghrebi lineage lasting roughly 8,000 years. Then, around 7,400 years before present, farmers with mostly European Neolithic-related ancestry appeared at Kaf Taht el-Ghar in northern Morocco. Iberia is the best-supported source; some contribution via Sicily cannot be excluded.

These farmers already carried a mixture shaped by earlier migrations across Europe. One model estimates 72% Anatolian Neolithic-related, 10% European hunter-gatherer-related and 18% local Maghrebi-related ancestry. Contact with local groups was dated to about 6–13 generations before the sampled people.

Yet nearby history took another path. At Ifri n’ Amr o’Moussa, people adopted farming practices while retaining their local genetic background, with no detectable incoming European farmer ancestry. Ideas could spread without the same movement of genes.

Later, around 6,700–6,100 years before present, Skhirat-Rouazi people show a different mixture: about 76% Levant Neolithic-related and 24% local Maghrebi-related ancestry. This suggests a separate eastern influx, potentially linked to pastoralism—not proof of a particular language or exact route.

By the Late Neolithic, all three ancestry backgrounds were present together at Kehf el Baroud. North African diversity had deep prehistoric roots, long before later historical migrations.

These are model estimates for ancient sampled communities, not ethnic percentages or a breakdown of Moroccan DNA today. Dates “before present” use AD 1950 as their reference.

📚 Source: Simões et al. (2023), Nature
Northwest African Neolithic initiated by migrants from Iberia and Levant

🧬 Curious about your own ancestry?
🌍 Explore your DNA at https://www.worldgenetics.app/
  • ❤ 3
  • 👍 3
Post #97 305
Chile's genetic profile reflects centuries of Native American, European and smaller African ancestry mixing.

A Nature Communications study analyzed 313 Chileans from across the country. Using weighted ancestry estimates, the population was modeled at roughly 55% European, 42% Native American and 2–3% African ancestry.

The European component was genetically closer to Spaniards and Italians than to British or northern-European references, consistent with Chile's colonial history. On the Native American side, Chileans were closer to Aymara and Quechua populations from the central Andes than to Maya or Nahua groups farther north.

Ancestry also changes geographically. Central Chile carried the highest European contribution, reaching about 57% in one central zone.

African ancestry was small overall but followed a clear north–south gradient: approximately 3.9% in the northernmost zone, declining to 1.3% in the far south. The authors connect this pattern to the historical distribution of African slavery along the Pacific coast.

The sex chromosomes reveal another colonial signature: European ancestry was disproportionately male-derived, while Native American ancestry was more strongly female-derived.

Individual variation was enormous. Native American ancestry ranged from about 13% to 91%, while European ancestry ranged from roughly 8% to 99%.

📚 Source: Eyheramendy et al. (2015), Nature Communications
Genetic structure characterization of Chileans reflects historical immigration patterns

🧬 Curious about your own ancestry?
🌍 Explore your DNA at https://www.worldgenetics.app/
  • 👍 3
Post #96 338
Ancient DNA has provided some of the strongest evidence yet for the eastern origins of the early Magyars.

A 2025 Cell study generated genome-wide data from 131 ancient individuals spanning the Volga-Ural region and the Carpathian Basin. The strongest genetic links connected 10th-century Magyars in Hungary with populations of the Karayakupovo horizon around the southern Urals.

The connection goes beyond broad ancestry. Researchers identified long shared DNA segments between individuals buried thousands of kilometers apart, indicating relatively recent common ancestors and, in some cases, distant biological relationships.

The deeper ancestry of these Ural groups points farther east. In key models, ancestry related to late Iron Age populations from the Tobol region of western Siberia contributed at least ~70% to several Karayakupovo and closely connected Magyar individuals.

Early Magyars were nevertheless genetically diverse. Some carried ancestry best represented by ancient northern Eurasian proxies, while others showed more Baikal-related ancestry. Additional Central Asian-related gene flow may have entered the population during their westward journey rather than in their Ural homeland.

The migration itself may have been remarkably fast. Some individuals could potentially have traveled from the Volga-Ural region to the Carpathian Basin within a single generation.

And not everyone left. Genetically related populations survived around the lower Kama into the 14th century, possibly corresponding to the Magna Hungaria described by medieval travelers.

📚 Source: Gyuris et al. (2025), Cell
Long shared haplotypes identify the southern Urals as a primary source for the 10th-century Hungarians

🧬 Curious about your own ancestry?
🌍 Explore your DNA at https://www.worldgenetics.app/
  • 🥰 2
Post #95 337
Ancient DNA has revealed that the origins of modern Japanese populations are more complex than the traditional two-way Jōmon + Yayoi model.

A Science Advances study analyzed 12 newly sequenced ancient Japanese genomes spanning around 8,000 years, alongside previously published Jōmon and Yayoi genomes.

The first major ancestry layer comes from the Jōmon, a deeply diverged population whose lineage became increasingly isolated from mainland Asia roughly 15,000–20,000 years ago. Genetic modeling suggests they maintained a very small effective population size of around 1,000 for thousands of years.

That isolation ended during the Yayoi period. Migrants carrying predominantly Northeast Asian-related ancestry entered Japan alongside wet-rice agriculture. At one site in northwestern Kyushu, Yayoi individuals were modeled as roughly 50–60% Jōmon, suggesting substantial assimilation rather than simple population replacement.

But the migrations did not stop there.

During the Kofun period, beginning around 1,700 years ago, another major influx introduced much more widespread East Asian-related ancestry, genetically distinguishable from the earlier Yayoi-associated migration.

By this period, Japan already carried the three ancestry components that remain foundational to mainland Japanese populations today: Jōmon, Northeast Asian and broader East Asian ancestry.

📚 Source: Cooke et al. (2021), Science Advances
Ancient genomics reveals tripartite origins of Japanese populations

🧬 Curious about your own ancestry?
🌍 Explore your DNA at https://www.worldgenetics.app/
  • ❤ 2
  • 🥰 1
Post #94 294
France may look genetically homogeneous at the European scale, but genome-wide data reveal clear regional differences in its ancestry.

Researchers analyzed 2,184 people born across continental France and consistently identified six broad genetic regions: Southwest, South, Center, Northwest, North and Southeast. These divisions closely followed geography and historical regions.

When French populations were modeled using three major prehistoric sources, Neolithic Farmer-related ancestry was the largest component, at roughly 46.5–66.2% across regions.

Steppe-related ancestry ranged from approximately 19.6–41.2%, reaching its highest levels in northwestern France. Western Hunter-Gatherer ancestry was smaller, around 6.3–16.2%, with the highest estimates in the southwest. The authors caution that this simplified three-way model does not perfectly fit every region, so these percentages are approximate.

The regional affinities are equally striking. Southwestern France shows stronger Iberian and Basque-related affinity, while southeastern France shifts more toward Italian references. Northern and northwestern France show stronger northwestern European affinity.

Brittany is particularly distinctive: it is genetically closer to northwestern Europe than to northern France, a pattern the authors suggest may partly reflect historical migration from Britain into Armorica.

These differences remain small overall, but they show how prehistoric migrations, neighboring populations, rivers, mountains and centuries of regional history helped shape the genetic landscape of modern France.

📚 Source: Saint Pierre et al. (2020), European Journal of Human Genetics
The genetic history of France

🧬 Curious about your own ancestry?
🌍 Explore your DNA at https://www.worldgenetics.app/
  • ❤ 2
  • 👍 1
Older posts →
Threads Profile ViewerView any public Threads profile without an account.Open ThreadLook →Writing with AI? Make it sound human.Metric37 rewrites AI drafts so they read naturally. Free AI detector, 1,500 words free.Try Metric37 →