TGViewer
Channel Public Channel
Geoalert Blog

Geoalert Blog

@geoalert

About Mapflow AI. Deep learning CV and Earth Observation data. What satellites can see? Monitoring of Environment, Land use; Urban planning and Mapping. Check all our blog posts here: https://mapflow.ai/blog
Сontact us at hello@geoalert.io
Subscribers
413
Photos
515
Videos
35
Links
392
Recent Posts 14 shown
Post #877 41
From terrain to a radio plan, then kept current

1. Load the terrain
Start from a terrain model of the area: Copernicus GLO-30 or the elevation data you already use.
2. Generate the city from fresh imagery
Mapflow classifies land use and extracts every building and tree, with its height, from recent satellite imagery.
3. Plan the radio network
Load the layers into your planning tool and predict coverage on the city as it stands today. (We convert data into Atoll's or other software formats)
4. Update only what changed
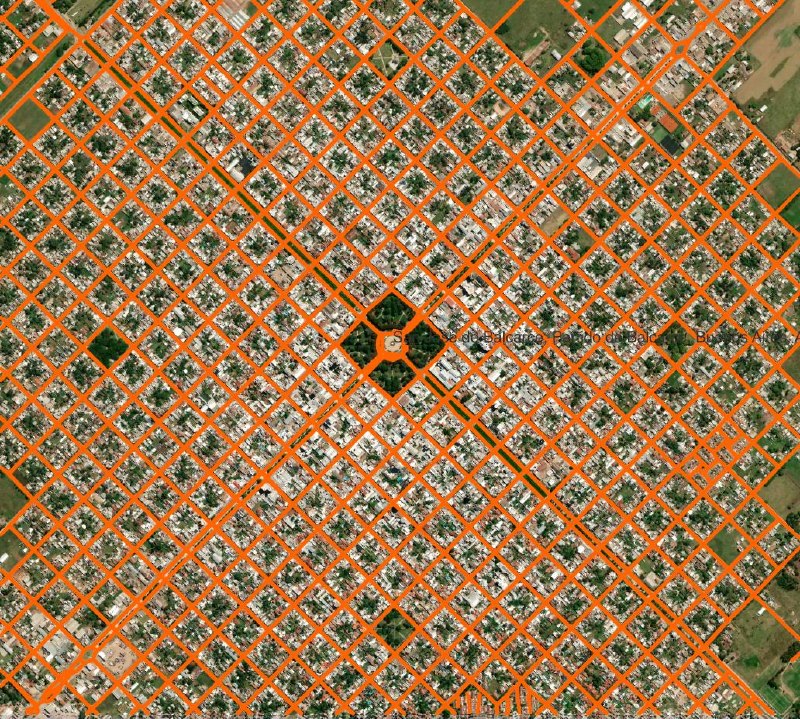
When new imagery shows a change, such as this construction site, Mapflow re-maps only that area and you recalculate the network.

👉 Learn more about Mapflow Telecom tailored solutions.
👉 Request us to run a demo or pilot project in the area of your network.
  • 👍 2
  • 🤩 2
Post #874 74
🚗 Mapflow Roads Model — Update!

We've released a significantly improved version of our Roads segmentation model!

Roads is one of Mapflow's core basemap models, primarily designed to extract narrow roads and local road networks, especially in areas where OpenStreetMap and other public maps have limited coverage.

📊 How much better?

We evaluated the new model using SpaceNet 3 benchmark datasets and our validation data. Across seven datasets, compared with the previous one:

• IoU: +55% — more accurate road coverage
• Topo-F1: +63% — better road network connectivity

The second metric is especially important for routing, where roads may be partially hidden by trees, buildings or shadows.

🗺️ Two workflows available:

• 🚗 Roads — connected road networks, postprocessed into buffered polygons for easier mapping.
• Buildings + Vegetation + Roads — lighter road postprocessing, better suited for combined land-cover analysis.

👉 Give it a try and rate your processing results
  • 🔥 6
  • 👍 3
Post #872 113
🚀 AOI list management further improvements
While you're viewing the processing results ("View on the map") you can edit AOI names, iterate through the list of AOIs and download each area's geometry and results.
Especially useful when you process many AOIs in a single run.
  • ❤ 2
  • 👍 1
Post #871 137
🧑‍🤝‍🧑Team management, redesigned

To tell the truth it didn't go well with the user's adoption of the first version becuase of UI, it's appeared to be more than confusing.
Teams in Mapflow are now much simpler.

• "Team" has moved from Settings to the main sidebar menu
• The Admin invites people by email, and they join with one click
• Members spend the Team's credits, while their personal balance stays untouched
• The Admin adds or withdraws credits for any member right from the members list
👀 Both your Team and personal balances are shown in the header

👉 Guide docs
  • ❤ 2
  • 👍 2
  • 🔥 1
Post #870 146
🌲 Forest and trees workflow was updated with two models, both benchmarked against thoroughful manual labels.

🚀 Tree crowns, v.2026-09-10

Crown polygons re-evaluated on 7 AOIs against manually annotated crowns:

mean F1 0.824 → 0.849

Neighbouring canopies are separated instead of merged — which is what tree counting actually depends on.
Run it with the Tree crowns option on 0.3 m imagery (zoom 19): polygons, or points.

🚀 Canopy Height Model, v.2026-08-31

Benchmarked against lidar-derived ground truth on 5 m hexagons. Across 38 AOIs the mean absolute height error drops from 4.70 m to 3.24 m (−31%).

Better heights mean a more reliable split into shrubs <4 m / forest 4–10 m / forest >10 m — the ranges used for vegetation management along power lines and transport corridors, which is customizable.

📖 Read more in our docs:
📊 Per-location benchmarks, with prediction-vs-ground-truth overlays:
1) Crowns 👈 2) CHM 👈
  • 👍 5
  • 🔥 2
Post #869 126
📍AOI management update

Have a long list of areas to map? You can process them one by one, or combine them in a single GeoJSON file and run them all in one go.

Now you can easily manage your areas of interest (AOIs) directly in the map view: navigate the list, check results, and download AOI geometries.
See how it works in a short video. 👀🤗
  • 👍 4
Post #868 168
🌳 How many trees are in New York’s Central Park—and what can we learn from imagery?

The source of truth, Central Park Conservancy, cites more than 18,000 trees. We explored the park with Mapflow’s updated vegetation and tree crown detection model, which mapped 23,846 crowns.

This is an automated detection result, with differences from the inventory still to investigate.

The workflow started with a single prompt to Mapflow Agent.

👨‍🔧 From mapping trees and estimating their heights to detecting cars or solar panels, describe your task and let the Agent select the relevant model, run the processing pipeline, and help interpret the results.

What would you map in your area?
  • 👍 8
Post #866 159
We are sharing a story from our long-term client Instituto de Información e investigación geográfica, estadística y catastral del Estado de México (IGECEM 🇲🇽).

Francisco Polo, Geography Department Manager:
IGECEM uses Mapflow to streamline urban area monitoring for cadastral purposes. As cities grow, IGECEM leverages Mapflow custom model to track urban sprawl. By analyzing changes in building coverage over time the Institute can gain valuable insights into city development patterns.
  • 👍 5
Post #865 208
Multi-model, Landuse + Results summary.
Go to demo processings in Mapflow public project to test it.
  • 👍 2
  • 🔥 1
Post #864 190
📊 #Mapflow now summarizes your processing results

Getting a vector layer is only part of the imagery analysis workflow. The next question is: what did the model actually find?

Now every Mapflow result opens with an instant summary:

🏠 Buildings — counts and types
🚗 Roads — total length
🌍 Land Use — area by category

Each model highlights the statistics that matter for its output.

You can download the results as a CSV file, or ask the Mapflow #Agent about them directly. The Agent receives the structured statistics instantly and can help you understand the results in more detail.

The new service is powered by Statistics API and available for every default model. Custom-model workflows currently include basic statistics, but their summaries can also be customized. PDF reports will come soon.

We love this new feature and hope you will enjoy it. 🤗 Tell us which metrics you would like to see in a custom or default workflow's summary.
  • 👍 5
Post #863 177
We’re sharing a new story on the Mapflow blog: a geographical snapshot of Mapflow demand in 2026 so far.

On the interactive map, you can switch between the number of jobs, average area per processing, and total area covered.

So far this year, 6,521 people have run 18,745 processing jobs, mapping 44,433 km². That’s roughly the land area of Estonia—mapped one shot at a time, by users across 178 countries.

So, what does the map reveal?
Mapflow.AI Where Mapflow ran in 2026: reading the demand for aerial imagery mapping | Mapflow.AI Blog We put every area our users mapped in 2026 onto a single world map — 18,745 processings, 44,433 km² of ground, 178 countries. Two of those countries turn out to run on imagery our users bring themselves, and that changes what we build next.
  • 👍 4
Post #861 193
Afer-coworking time on the stairs of Konzerthaus, Berlin. Occasional #workspace. 👨‍💻😎
  • 👍 5
  • 🔥 4
Post #860 244
A brief line-up of AI-mapping #Mapflow models. The models are the core stack of the platform that orchestrates them and provides services to manage the input data.

Mapflow turns satellite and aerial imagery into ready-to-use vector maps. Here's what's in the box:

🏠 Buildings — global, 0.3 m / z19. Extracts rooftops, plus optional building-type classification, contour regularization, simplification, merge with OSM, and height estimation (beta) that projects the roof down to ground level for true 3D footprints. 📊 v.2026-07-06: mean F1 0.893 (aerial), 0.881 (satellite)

🌲 Forest & trees — global, 0.6–0.3 m. A solid vegetation mask covering sparse forest, shrubland, small tree groups and narrow tree lines. Options: height classes (<4 m / 4–10 m / >10 m) and individual tree crowns as polygons or points. 📊 v.2026-07-03: mean F1 0.850 — up from 0.513 in the previous version

🚗 Roads — 0.3–0.5 m, tuned for rural and suburban areas. Multi-task learning keeps the mask connected where roads hide under trees; centerline extraction plus graph cleanup (gap merging, simplification, removal of stray segments).

🧩 Buildings + Roads + Forest — all three in a single run, returned as one topology-corrected GeoJSON.

🗺 Open Data — pull OpenStreetMap and Overture layers with no AI involved, as a complement to model output.

⚙️ Custom models, on request: construction sites, high-density housing, agriculture fields, Segment Anything (zoom-dependent, from land use down to single trees), swimming pools (F1 > 0.95), solar panels. You can also bring your own model — or ask us to train one for your use case.

Run it all in the web app, the #QGIS plugin, or via #API. 🔗 mapflow.ai/models · docs.mapflow.ai
Mapflow.AI Mapflow AI Models for Satellite Imagery Production AI models for satellite imagery — buildings, forest, roads and more. We train and host them, so you get results without running any ML infrastructure.
  • 🔥 5
Post #859 204
🛰️ My Imagery Search update in Mapflow

Have you ever struggled to find the right image among all the files you’ve uploaded?

A list of filenames is not always enough—especially when you need to check which images cover a specific project area without opening them one by one.

Now you can search across your own imagery and collections using the same tools available in Mapflow’s Imagery Search:

📍 Search for your data geographically or by intersection with your area of interest

👉 Additionally you can fill out the metadata profile for your image which enables more filters like Date, Clouds, Off-nadir, etc.

Your uploaded imagery is now easier to find, evaluate, and reuse across projects.
⚙️ Find suitable imagery and launch AI processing directly from the search results


Try it in Mapflow → https://app.mapflow.ai
  • 🔥 5
  • 👍 2
  • 🤩 1
Older posts →

About this channel

How can I read @geoalert without a Telegram account?
TGViewer shows the public web preview Telegram publishes for Geoalert Blog: recent posts, photos, videos and the subscriber count, with no app, login or account.
How many subscribers does Geoalert Blog have?
Geoalert Blog (@geoalert) has 413 subscribers on Telegram, refreshed roughly every 30 minutes.
Does Geoalert Blog know I viewed it here?
No. Public channel previews carry no viewer identity, and TGViewer has no accounts or tracking of what you look up.
Threads Profile ViewerView any public Threads profile without an account.Open ThreadLook →Writing with AI? Make it sound human.Metric37 rewrites AI drafts so they read naturally. Free AI detector, 1,500 words free.Try Metric37 →