TGViewer
Channel Public Channel
Macro & Markets | Reza Ghanipour

Macro & Markets | Reza Ghanipour

@rezamacroedge

Global Markets Analyst
Macro | FX | Commodities
Educator | Independent Research
Subscribers
81
Photos
40
Videos
0
Links
12
Recent Posts 19 shown
Post #102 22
My EUR/USD Scenario

My outlook for EUR/USD is the inverse of my DXY view. In the short term, I expect the pair to remain under pressure, with the dollar potentially benefiting from relatively higher US yields, interest-rate differentials, and continued demand for USD liquidity.

However, my long-term outlook is more constructive on the euro. Over a multi-year horizon, persistent US fiscal deficits, rising government debt, and a gradual erosion of the dollar’s relative advantage could create a structural headwind for the USD. If this plays out, EUR/USD could eventually transition into a broader long-term uptrend.

Therefore, my base case is short-term weakness followed by long-term strength in EUR/USD. I am not expecting the transition to be linear; the pair could experience significant counter-trend rallies and corrections along the way.

In short: I see EUR/USD lower before I see it structurally higher.

➖➖➖➖➖➖➖➖
@RezaMacroEdge
  • 👍 2
Post #100 74
My DXY Scenario

In the short term, my outlook for the US Dollar Index remains bullish. I expect relatively high interest rates, elevated Treasury yields, and safe-haven demand amid global risk to continue supporting the dollar. Based on the technical structure, my target is for DXY to gain around 5% by October 2027.

However, my view changes over the multi-year horizon. Persistent fiscal deficits, rising US government debt, pressure for lower interest rates, and a gradual erosion of the relative advantage of dollar-denominated assets could create significant headwinds. As the global financial system develops more alternatives for reserve assets and international settlement, structural dependence on the dollar could also gradually decline.

Therefore, my base case is short-term dollar strength followed by gradual long-term deterioration. I am not expecting an immediate collapse, but rather another leg higher before a broader multi-year downtrend.

➖➖➖➖➖➖➖➖
@RezaMacroEdge
  • ❤ 2
  • 👍 2
Post #99 40
The Concept of a Reference Point in Prospect Theory

Kahneman and Tversky’s Prospect Theory introduces an interesting concept called the Reference Point. The idea is pretty simple: we don’t evaluate prices, gains, and losses in absolute terms. We judge them relative to a mental reference point.

For example, someone who bought Bitcoin at $70K sees the market differently from someone who bought at $40K. And someone who doesn’t own Bitcoin at all will have a completely different perspective.

So the exact same price can have three completely different meanings for three different people.

And the important part is that your reference point isn’t necessarily your purchase price. It could be the previous high, an expected price, yesterday’s price, or even a price you simply consider “reasonable.”

This is where markets get interesting. At $85K, one person might say: “It's already expensive. A correction is coming.”

Another might say: “The trend is bullish. If $85K has been established as support, why should I wait for $65K?”

They’re looking at the exact same chart, but from different mental reference points.

Even two people who bought at exactly the same price can make completely different decisions at the same market price if their time horizons and scenarios are different.

That’s why the question of “Where should I buy?” doesn’t necessarily have the same answer for a long-term investor and a short-term trader.

Sometimes, what we call “expensive” or “cheap” says less about the price itself and more about the reference point in our own heads. And the market, of course, has no obligation to align with it.

There’s also an interesting connection here with an old idea from the Austrian School of Economics: value is not an inherent and fixed property of a good. It depends on individual subjective judgment.

Carl Menger approached value from this perspective: the value of a good comes from its relationship with human needs and preferences, rather than from some objective “intrinsic value” embedded in the good itself.

So before asking:
“Is this asset expensive or cheap?”
Maybe we should ask:
“Expensive or cheap relative to what?”

Because very often, what we call “expensive” or “cheap” isn’t an absolute property of the price.
It’s the result of the reference point we’ve constructed in our own minds.

Prospect Theory — Kahneman & Tversky
Reference-Point Effects — ScienceDirect

➖➖➖➖➖➖➖➖
@RezaMacroEdge
CaltechAUTHORS The disposition effect in securities trading: an experimental analysis The 'disposition effect' is the tendency to sell assets that have gained value ('winners') and keep assets that have lost value ('losers'). Disposition effects can be explained by the two features of prospect theory: the idea that people value gains and losses…
  • ❤ 2
Post #98 86
Macro & Markets | Reza Ghanipour What Works When Inflation and Growth Change? ➖➖➖➖➖➖➖➖ @RezaMacroEdge
This chart looks at how different assets have historically behaved under two major economic variables: economic growth and inflation, covering 1972 through June 2026.

X-axis = sensitivity to inflation
Y-axis = sensitivity to economic growth

So, the further an asset is to the right, the more positively it has historically responded to inflation. The higher it is, the more positively it has responded to economic growth. The chart basically divides the economy into four environments:

🟢 Goldilocks — strong growth + low inflation
Equities and other risk assets generally tend to perform better here.

🟡 Overheating — strong growth + high inflation
Commodities, energy and other inflation-sensitive assets become more relevant.

🔵 Recession — weak growth + low inflation
Treasuries and higher-quality defensive assets tend to be more resilient in this environment.

🔴 Stagflation — weak growth + high inflation
And this is where the chart gets particularly interesting: Gold and commodities sit in this part of the chart.

Historically, gold has shown positive sensitivity to inflation and negative sensitivity to economic growth. In other words, an environment where economic growth weakens while inflation remains elevated can create a very different setup for gold compared with equities and bonds.

And I think that's the key takeaway: No asset is designed to perform well in every economic environment. The wrong question is simply:

“Are stocks good?”
“Is gold good?”


The better question is: What economic environment are we in, and which assets are historically better positioned for that environment?

That's why I prefer looking at asset allocation and different economic scenarios, rather than betting everything on a single asset. Of course, this chart isn't a forecast of the future. It's a historical view of how different assets have behaved across more than five decades.

Good investing isn't just about choosing an asset. It's about choosing the right mix of assets for different scenarios.


➖➖➖➖➖➖➖➖
@RezaMacroEdge
  • 🔥 2
Post #97 79
What Works When Inflation and Growth Change?

➖➖➖➖➖➖➖➖
@RezaMacroEdge
  • 👍 1
Post #96 86
Sometimes buying at $120 is less risky than buying at $100.

At first, this sounds strange, because we usually assume that a lower price means a better opportunity. But price alone tells us neither the risk nor the potential return.
Imagine an asset trading at $100.

If an important support level hasn't been confirmed yet, you may need a relatively wide stop-loss for your thesis to be invalidated. Now imagine the same asset reaches $120, breaks an important resistance level, and confirms the market structure.

The price is higher, but the risk of the trade may actually be lower — because the invalidation point is clearer and the distance to the stop-loss is smaller.

This is where an important distinction matters:

Risk is how much you stand to lose if your analysis is wrong.
Return is how much you stand to gain if your scenario plays out.

So a good trade isn't necessarily one where you buy at the lowest price. It's one where the potential loss is reasonable relative to the potential gain.

For example, at $100, an asset might have 30% upside potential, but require you to risk 15%. At $120, the upside might be only 20%, but the risk could be just 5%.

In the second case, you're buying at a higher price, but the risk/reward ratio can actually be better.

That's why I don't just ask:
"How cheap is it?"

The more important questions are:

If I'm right, how much can I make?
If I'm wrong, how much can I lose?


And this is exactly where the difference between a general market analysis and analysis that can actually be used for personal investment decisions becomes clear. In the advisory work I provide, the goal isn't simply to give you a few stocks or entry points.

The entry scenario, risk level, invalidation point, potential return, and position management should all be defined before entering the trade.
Because buying an asset isn't the difficult part.

Deciding when to buy it, how much to allocate, and how much risk to take — that's where the real work begins.

➖➖➖➖➖➖➖➖
@RezaMacroEdge
  • ❤ 2
Post #95 180
One of the biggest mistakes traders make is thinking they need to find a trading strategy. In reality, you need to build your own.

What has always seemed strange to me is hearing things like: “NeoWave says you should analyze the market this way,” or “Price Action says you should trade it like this.”
Anyone with real trading experience, especially in Forex, knows there’s a fundamental problem with that mindset.

Every successful trader develops their own approach by combining different techniques, experience, continuous market observation, and a sound risk management system — for a specific market, under specific conditions, and over a specific period of time.

I’ve never seen a successful trader achieve lasting success simply by copying someone else’s method without adapting it to their own experience and trading personality. You’re not supposed to become a second version of another trader. You need to find your own trading signature.

My trading philosophy is very simple: I’m not interested in complicated things that only look impressive on paper. I want to focus on things that are simple, observable, and repeatable — things I can execute again and again throughout every trading day.

Because trading isn’t built around one spectacular trade. It’s built by repeating a simple process with a genuine edge. A good trading system isn’t one that works on a single chart. It’s one you can execute hundreds of times.

➖➖➖➖➖➖➖➖
@RezaMacroEdge
  • 🔥 4
Post #93 172
The cost of copper exploration has risen sharply in recent years.

➖➖➖➖➖➖➖➖
@RezaMacroEdge
  • ❤ 3
Post #92 203
Macro & Markets | Reza Ghanipour But there is another player entering this equation: Japan. ➖➖➖➖➖➖➖➖ @RezaMacroEdge
But there is another player entering this equation: Japan.

For years, Japan has been one of the largest foreign holders of U.S. Treasuries. But the dynamics of its domestic bond market are changing. The yield on Japan’s 10-year government bond has reached around 3% for the first time since 1996. After decades of near-zero interest rates, Japanese assets are becoming increasingly attractive again.

And this creates an important problem. If Japanese yields continue to rise, the incentive for Japanese investors to hold foreign assets — including U.S. Treasuries — declines. In a more extreme scenario, we could see part of that capital flow back into Japan. And that is not good news for the U.S.

Large-scale Treasury selling would put downward pressure on bond prices and push yields higher. In other words, just as the U.S. government is already dealing with massive debt and rising interest costs, its borrowing costs could come under even more pressure.

And this is where Japan connects directly to the issue we discussed earlier: The debt crisis.

If interest rates remain high, the cost of servicing the debt keeps rising. But if policymakers respond by pushing rates lower through more accommodative monetary policy, liquidity increases — along with the risk of inflation and currency depreciation.

Eventually, policymakers may face the same choice: Debt crisis or inflation.

For the U.S., in an extreme scenario, allowing inflation to erode the real value of its debt may prove less painful than facing a Treasury market with persistently higher yields.

This is why U.S. Treasury Secretary Scott Bessent’s concerns about potential Japanese Treasury selling are worth watching. The issue is not just Japan.

If one of the world’s largest foreign holders of Treasuries begins reducing its exposure, the pressure can spill over into the entire U.S. bond market.

So what we are seeing in Japan may not simply be a story about the yen or the Japanese economy. It could be another piece of the same global debt problem — one that ultimately determines the direction of global liquidity and the price of gold.

And if this scenario plays out, the higher yields that are currently a headwind for gold could eventually become the very thing that forces policymakers toward more liquidity.

A debt crisis can be gold’s short-term enemy; the response to that crisis could become the fuel for its next major rally.

Perhaps that is why valuing gold based solely on today’s price misses the bigger picture.

The real question is: Who ultimately pays for all this debt?

➖➖➖➖➖➖➖➖
@RezaMacroEdge
  • 👍 1
Post #91 121
But there is another player entering this equation: Japan.

➖➖➖➖➖➖➖➖
@RezaMacroEdge
Post #90 130
Major Market Alert!

The ratio of commodity prices to the S&P 500 is currently near one of its lowest levels in the past 50 years.

History clearly shows that when this ratio gets this low, one of these three usually happens:

Commodities go up
Stocks fall
Or both

Right now, commodities look extremely cheap relative to stocks.
Mean reversion is almost inevitable...

Which scenario do you think is most likely?

➖➖➖➖➖➖➖➖
@RezaMacroEdge
Post #87 115
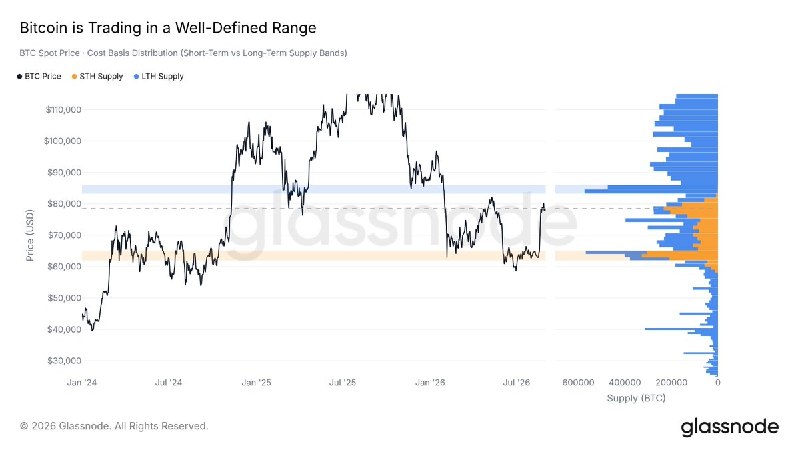
Bitcoin Is Trapped Between Two Liquidity Pools

Bitcoin is currently trading in a well-defined range, with two zones standing out:

🔺 $82K–$86K
Heavy liquidation liquidity + significant cost basis. A break above $85K could trigger a short squeeze and fuel the next move higher.

🔻 $62K–$65K
Strong short-term holder supply + a large pool of long liquidations. Holding this zone could form a bottom, while a decisive break could trigger a long squeeze and accelerate the downside.

One important point: the liquidation heatmap is not a price prediction. It shows where the market is vulnerable to forced buying or selling.

So I’m watching how BTC reacts at these two edges, not trying to predict the middle of the range. Break one side with confirmation, and we may have our next major move.

➖➖➖➖➖➖➖➖
@RezaMacroEdge
Post #86 131
Macro & Markets | Reza Ghanipour Gold’s Fundamental Valuation ➖➖➖➖➖➖➖➖ @RezaMacroEdge
🟨 Gold’s Fundamental Valuation

One interesting way to estimate the fundamental value of gold is to compare its price with M2, or global money supply, measured in U.S. dollars. In this framework, gold is not valued purely based on physical supply and demand. Instead, its price is compared with the amount of money circulating in the global economy. The M2-to-gold ratio is one way to examine this relationship. (In Gold We Trust)

The important point is that the relationship between M2 and gold is not linear in the short term. Real interest rates, the dollar, systemic risk, and capital flows can all distort this relationship for extended periods. But over the long term, monetary expansion is one of the key drivers of gold’s nominal price. And global liquidity remains at historically elevated levels. (StreetStats)

But I think the bigger story lies elsewhere. The world is facing a major debt problem. If this debt crisis eventually leads to aggressive monetary intervention, lower real rates, government bond purchases, and more liquidity creation, what is a risk for gold today could become one of its strongest drivers of growth in the medium term.
Put simply: A debt crisis can push gold lower in the short term. But if policymakers respond by creating more liquidity, that same crisis could become the fuel for gold’s next major rally. And perhaps that is why valuing gold simply by looking at today’s price doesn’t tell us the whole story.

➖➖➖➖➖➖➖➖
@RezaMacroEdge
ingoldwetrust.report M2 Gold Ratio Chart - US Money Supply/Gold - In Gold We Trust The M2 Gold Ratio Chart shows the US money supply M2 divided by the price of one ounce of gold since 1970. Analyse gold indicators now!
  • ❤ 3
Post #84 334
The Economist Telegram Inflation: The Silent Theft of Your Purchasing Power @The_Economist_Telegram
Inflation: The Silent Theft of Your Purchasing Power

Your $100 is still $100. But here’s the real question: How much can that $100 actually buy today?

Inflation doesn’t need to take money out of your bank account. It only needs to erode its purchasing power year after year.

Since 2019, cumulative inflation has significantly reduced the real value of cash across many economies.

The lesson for investors
A stable nominal balance does not mean your wealth has been preserved.

If your portfolio gains 10% while inflation runs at 15%, you made money on paper—but lost purchasing power in real terms.

That’s why investors should care about real returns, not just nominal returns.

Cash provides liquidity and optionality. But holding all your wealth in cash for years can mean watching your purchasing power quietly disappear.

This is why long-term portfolios often allocate part of their capital to productive or scarce assets such as:

• Equities
• Real estate
• Infrastructure
• Commodities
• Precious metals
• Private markets
• Inflation-protected bonds

Ultimately, the question isn’t simply:

“How much money do I have?” The better question is: “How much purchasing power will my wealth have in 5, 10, or 20 years?”

Because inflation rarely takes your money by force. It simply makes your money worth a little less every year.

➖➖➖➖➖➖➖➖
@RezaMacroEdge
  • 👍 2
Post #82 69
BITCOIN IS APPROACHING ITS BULL MARKET LINE

➖➖➖➖➖➖➖➖
@RezaMacroEdge
  • 👍 1
Older posts →

About this channel

How can I read @rezamacroedge without a Telegram account?
TGViewer shows the public web preview Telegram publishes for Macro & Markets | Reza Ghanipour: recent posts, photos, videos and the subscriber count, with no app, login or account.
How many subscribers does Macro & Markets | Reza Ghanipour have?
Macro & Markets | Reza Ghanipour (@rezamacroedge) has 81 subscribers on Telegram, refreshed roughly every 30 minutes.
Does Macro & Markets | Reza Ghanipour know I viewed it here?
No. Public channel previews carry no viewer identity, and TGViewer has no accounts or tracking of what you look up.
Threads Profile ViewerView any public Threads profile without an account.Open ThreadLook →Writing with AI? Make it sound human.Metric37 rewrites AI drafts so they read naturally. Free AI detector, 1,500 words free.Try Metric37 →