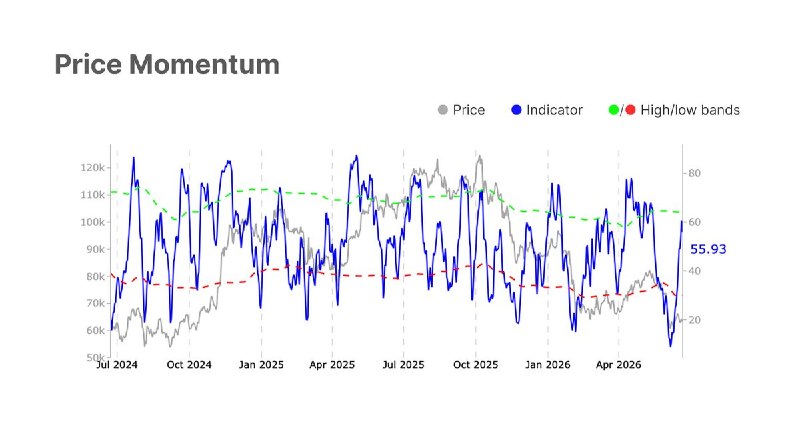
BTC is back at a major support zone as price tests the February lows.
Here's what BTC options data reveals about positioning, volatility, and sentiment beneath the surface.
Volatility Cools From Recent Highs
BTC implied volatility has eased despite price testing the Feb lows.
1 week IV has fallen from 60% to 35%, with the rest of the curve also drifting lower.
The market is pricing less uncertainty than two weeks ago.
https://glassno.de/4elkXSsProtection Demand Normalizes
25D skew has eased from the extreme levels reached during the June selloff.
1 week skew has fallen from nearly 30% to 15%, with the rest of the curve also normalizing.
The rush for downside protection has largely subsided.
https://glassno.de/4oCtPGRCalls Continue to Lose Ground
The skew index ratio compares upside IV against downside IV.
Near term options continue to favor downside exposure over upside participation.
https://glassno.de/44j2eRDVolatility Risk Premium Turns Negative
1M IV has fallen below realized volatility.
Implied volatility sits near 39%, while realized volatility has risen above 42%.
Recent price swings have exceeded what options markets are currently pricing.
https://glassno.de/4xID4cMShort Gamma Remains Dominant
The largest negative gamma cluster sits at 62K, just below spot, where $1.8B of short gamma is concentrated.
A move lower could accelerate a retest of 60K, where a small pocket of long gamma may help contain volatility.
https://glassno.de/3QvDHFCPut Buying Continues to Lead
Put buying dominated taker flow over the past 7 days, accounting for 28% of premium traded.
Put selling followed at 26.8%, while call buying represented 24.1%.
The tape continues to favor protection over upside exposure.
https://glassno.de/44kFm4aWrap Up
Implied volatility has cooled.
Protection demand has normalized.
Calls remain out of favor.
Realized volatility exceeds implied volatility.
BTC sits on a major short gamma cluster.
Flow continues to favor puts.
Defensive positioning persists near key support.