TGViewer
Channel Public Channel
Data Analyst Interview Resources

Data Analyst Interview Resources

@dataanalystinterview

Join our telegram channel to learn how data analysis can reveal fascinating patterns, trends, and stories hidden within the numbers! 📊

For ads & suggestions: @love_data
Subscribers
52.6K
Photos
364
Videos
1
Links
453

Showing posts older than #2078 · Back to latest

Older Posts 11 shown
Post #2076 1.68K
🧠 SQL Interview Question (Commonly Asked)
📌

orders(order_id, customer_id, order_date, order_amount)

❓ Ques :

👉 Find customers whose order amount strictly increased compared to their previous order.

🧩 How Interviewers Expect You to Think

• Order data correctly using dates
• Compare current row with previous row
• Use window functions for self-comparison
• Avoid self-joins when window functions fit better
• Filter only after comparison logic

💡 SQL Solution

WITH ranked_orders AS (
SELECT
customer_id,
order_date,
order_amount,
LAG(order_amount) OVER (
PARTITION BY customer_id
ORDER BY order_date
) AS prev_order_amount
FROM orders
)
SELECT DISTINCT
customer_id
FROM ranked_orders
WHERE order_amount > prev_order_amount;

🔥 React ♥️ if you want more moderate-to-advanced SQL interview questions
  • ❤ 5
  • 👌 1
Post #2074 1.6K
Complete Syllabus for Data Analytics interview:

SQL:
1. Basic
  - SELECT statements with WHERE, ORDER BY, GROUP BY, HAVING
  - Basic JOINS (INNER, LEFT, RIGHT, FULL)
  - Creating and using simple databases and tables

2. Intermediate
  - Aggregate functions (COUNT, SUM, AVG, MAX, MIN)
  - Subqueries and nested queries
  - Common Table Expressions (WITH clause)
  - CASE statements for conditional logic in queries

3. Advanced
  - Advanced JOIN techniques (self-join, non-equi join)
  - Window functions (OVER, PARTITION BY, ROW_NUMBER, RANK, DENSE_RANK, lead, lag)
  - optimization with indexing
  - Data manipulation (INSERT, UPDATE, DELETE)

Python:
1. Basic
  - Syntax, variables, data types (integers, floats, strings, booleans)
  - Control structures (if-else, for and while loops)
  - Basic data structures (lists, dictionaries, sets, tuples)
  - Functions, lambda functions, error handling (try-except)
  - Modules and packages

2. Pandas & Numpy
  - Creating and manipulating DataFrames and Series
  - Indexing, selecting, and filtering data
  - Handling missing data (fillna, dropna)
  - Data aggregation with groupby, summarizing data
  - Merging, joining, and concatenating datasets

3. Basic Visualization
  - Basic plotting with Matplotlib (line plots, bar plots, histograms)
  - Visualization with Seaborn (scatter plots, box plots, pair plots)
  - Customizing plots (sizes, labels, legends, color palettes)
  - Introduction to interactive visualizations (e.g., Plotly)

Excel:
1. Basic
  - Cell operations, basic formulas (SUMIFS, COUNTIFS, AVERAGEIFS, IF, AND, OR, NOT & Nested Functions etc.)
  - Introduction to charts and basic data visualization
  - Data sorting and filtering
  - Conditional formatting

2. Intermediate
  - Advanced formulas (V/XLOOKUP, INDEX-MATCH, nested IF)
  - PivotTables and PivotCharts for summarizing data
  - Data validation tools
  - What-if analysis tools (Data Tables, Goal Seek)

3. Advanced
  - Array formulas and advanced functions
  - Data Model & Power Pivot
- Advanced Filter
- Slicers and Timelines in Pivot Tables
  - Dynamic charts and interactive dashboards

Power BI:
1. Data Modeling
  - Importing data from various sources
  - Creating and managing relationships between different datasets
  - Data modeling basics (star schema, snowflake schema)

2. Data Transformation
  - Using Power Query for data cleaning and transformation
  - Advanced data shaping techniques
  - Calculated columns and measures using DAX

3. Data Visualization and Reporting
  - Creating interactive reports and dashboards
  - Visualizations (bar, line, pie charts, maps)
  - Publishing and sharing reports, scheduling data refreshes

Statistics Fundamentals:
Mean, Median, Mode, Standard Deviation, Variance, Probability Distributions, Hypothesis Testing, P-values, Confidence Intervals, Correlation, Simple Linear Regression, Normal Distribution, Binomial Distribution, Poisson Distribution.
  • ❤ 9
Post #2072 1.56K
✅ Data Analytics Essentials

TECH SKILLS (NON-NEGOTIABLE)

1️⃣ SQL
• Joins, Group by, Window functions
• Handle NULLs and duplicates
Example: LEFT JOIN fits a churn query to include non-churned users

2️⃣ Excel
• Pivot tables, Lookups, IF logic
• Clean raw data fast
Example: Reconcile 50k rows in minutes using Pivot tables

3️⃣ Power BI or Tableau
• Data modeling, Measures, Filters
• One dashboard, One question
Example: Sales drop by region and month dashboard

4️⃣ Python
• pandas for cleaning and analysis
• matplotlib or seaborn for quick visuals
Example: Groupby revenue by cohort

5️⃣ Statistics Basics
• Mean vs median, Variance, Correlation
• Know when averages lie
Example: Median salary explains skewed data


SOFT SKILLS (DEAL BREAKERS)

1️⃣ Business Thinking
• Ask why before how
• Tie insights to decisions
Example: High churn points to onboarding gaps

2️⃣ Communication
• Explain insights without jargon
• One slide, One takeaway
Example: Revenue fell due to fewer repeat users

3️⃣ Problem Framing
• Convert vague asks into clear questions
• Define metrics early
Example: What defines an active user?

4️⃣ Attention to Detail
• Validate numbers
• Double check logic
• Small errors kill trust

5️⃣ Stakeholder Handling
• Listen first
• Clarify scope
• Push back with data

🎯 Balance both tech and soft skills to grow faster as an analyst

Double Tap ♥️ For More
  • ❤ 7
Post #2070 1.8K
1. What are the ways to detect outliers?

Outliers are detected using two methods:

Box Plot Method: According to this method, the value is considered an outlier if it exceeds or falls below 1.5*IQR (interquartile range), that is, if it lies above the top quartile (Q3) or below the bottom quartile (Q1).

Standard Deviation Method: According to this method, an outlier is defined as a value that is greater or lower than the mean ± (3*standard deviation).


2. What is a Recursive Stored Procedure?

A stored procedure that calls itself until a boundary condition is reached, is called a recursive stored procedure. This recursive function helps the programmers to deploy the same set of code several times as and when required.


3. What is the shortcut to add a filter to a table in EXCEL?

The filter mechanism is used when you want to display only specific data from the entire dataset. By doing so, there is no change being made to the data. The shortcut to add a filter to a table is Ctrl+Shift+L.

4. What is DAX in Power BI?

DAX stands for Data Analysis Expressions. It's a collection of functions, operators, and constants used in formulas to calculate and return values. In other words, it helps you create new info from data you already have.
  • ❤ 7
Post #2068 1.98K
Data Analytics Interview Questions with Answers Part-1: 📱

1. What is the difference between data analysis and data analytics?
⦁ Data analysis involves inspecting, cleaning, and modeling data to discover useful information and patterns for decision-making.
⦁ Data analytics is a broader process that includes data collection, transformation, analysis, and interpretation, often involving predictive and prescriptive techniques to drive business strategies.

2. Explain the data cleaning process you follow.
⦁ Identify missing, inconsistent, or corrupt data.
⦁ Handle missing data by imputation (mean, median, mode) or removal if appropriate.
⦁ Standardize formats (dates, strings).
⦁ Remove duplicates.
⦁ Detect and treat outliers.
⦁ Validate cleaned data against known business rules.

3. How do you handle missing or duplicate data?
⦁ Missing data: Identify patterns; if random, impute using statistical methods or predictive modeling; else consider domain knowledge before removal.
⦁ Duplicate data: Detect with key fields; remove exact duplicates or merge fuzzy duplicates based on context.

4. What is a primary key in a database? 
A primary key uniquely identifies each record in a table, ensuring entity integrity and enabling relationships between tables via foreign keys.

5. Write a SQL query to find the second highest salary in a table.
SELECT MAX(salary) 
FROM employees
WHERE salary < (SELECT MAX(salary) FROM employees);


6. Explain INNER JOIN vs LEFT JOIN with examples.
⦁ INNER JOIN: Returns only matching rows between two tables.
⦁ LEFT JOIN: Returns all rows from the left table, plus matching rows from the right; if no match, right columns are NULL.

Example:
SELECT * FROM A INNER JOIN B ON A.id = B.id;
SELECT * FROM A LEFT JOIN B ON A.id = B.id;


7. What are outliers? How do you detect and treat them?
⦁ Outliers are data points significantly different from others that can skew analysis.
⦁ Detect with boxplots, z-score (>3), or IQR method (values outside 1.5*IQR).
⦁ Treat by investigating causes, correcting errors, transforming data, or removing if they’re noise.

8. Describe what a pivot table is and how you use it. 
A pivot table is a data summarization tool that groups, aggregates (sum, average), and displays data cross-categorically. Used in Excel and BI tools for quick insights and reporting.

9. How do you validate a data model’s performance?
⦁ Use relevant metrics (accuracy, precision, recall for classification; RMSE, MAE for regression).
⦁ Perform cross-validation to check generalizability.
⦁ Test on holdout or unseen data sets.

10. What is hypothesis testing? Explain t-test and z-test.
⦁ Hypothesis testing assesses if sample data supports a claim about a population.
⦁ t-test: Used when sample size is small and population variance is unknown, often comparing means.
⦁ z-test: Used for large samples with known variance to test population parameters.

React ♥️ for Part-2
  • ❤ 13
Post #2066 1.9K
Complete Syllabus for Data Analytics interview:

SQL:
1. Basic   
- SELECT statements with WHERE, ORDER BY, GROUP BY, HAVING   
- Basic JOINS (INNER, LEFT, RIGHT, FULL)   
- Creating and using simple databases and tables

2. Intermediate   
- Aggregate functions (COUNT, SUM, AVG, MAX, MIN)   
- Subqueries and nested queries
- Common Table Expressions (WITH clause)   
- CASE statements for conditional logic in queries
3. Advanced   
- Advanced JOIN techniques (self-join, non-equi join)   
- Window functions (OVER, PARTITION BY, ROW_NUMBER, RANK, DENSE_RANK, lead, lag)   
- optimization with indexing   
- Data manipulation (INSERT, UPDATE, DELETE)

Python:
1. Basic   
- Syntax, variables, data types (integers, floats, strings, booleans)   
- Control structures (if-else, for and while loops)   
- Basic data structures (lists, dictionaries, sets, tuples)   
- Functions, lambda functions, error handling (try-except)   
- Modules and packages

2. Pandas & Numpy   
- Creating and manipulating DataFrames and Series   
- Indexing, selecting, and filtering data   
- Handling missing data (fillna, dropna)   
- Data aggregation with groupby, summarizing data   
- Merging, joining, and concatenating datasets

3. Basic Visualization   
- Basic plotting with Matplotlib (line plots, bar plots, histograms)   
- Visualization with Seaborn (scatter plots, box plots, pair plots)   
- Customizing plots (sizes, labels, legends, color palettes)   
- Introduction to interactive visualizations (e.g., Plotly)

Excel:
1. Basic   
- Cell operations, basic formulas (SUMIFS, COUNTIFS, AVERAGEIFS, IF, AND, OR, NOT & Nested Functions etc.)   
- Introduction to charts and basic data visualization   
- Data sorting and filtering   
- Conditional formatting

2. Intermediate   
- Advanced formulas (V/XLOOKUP, INDEX-MATCH, nested IF)   
- PivotTables and PivotCharts for summarizing data   
- Data validation tools   
- What-if analysis tools (Data Tables, Goal Seek)

3. Advanced   
- Array formulas and advanced functions   
- Data Model & Power Pivot
- Advanced Filter
- Slicers and Timelines in Pivot Tables   
- Dynamic charts and interactive dashboards

Power BI:
1. Data Modeling   
- Importing data from various sources   
- Creating and managing relationships between different datasets   
- Data modeling basics (star schema, snowflake schema)

2. Data Transformation   
- Using Power Query for data cleaning and transformation   
- Advanced data shaping techniques   
- Calculated columns and measures using DAX

3. Data Visualization and Reporting   - Creating interactive reports and dashboards   
- Visualizations (bar, line, pie charts, maps)   
- Publishing and sharing reports, scheduling data refreshes

Statistics Fundamentals: Mean, Median, Mode, Standard Deviation, Variance, Probability Distributions, Hypothesis Testing, P-values, Confidence Intervals, Correlation, Simple Linear Regression, Normal Distribution, Binomial Distribution, Poisson Distribution.

Like for more 😄❤️
  • ❤ 4
  • 👍 2
Post #2064 1.66K
✅ Data Analytics Essentials

TECH SKILLS (NON-NEGOTIABLE)

1️⃣ SQL
• Joins, Group by, Window functions
• Handle NULLs and duplicates
Example: LEFT JOIN fits a churn query to include non-churned users

2️⃣ Excel
• Pivot tables, Lookups, IF logic
• Clean raw data fast
Example: Reconcile 50k rows in minutes using Pivot tables

3️⃣ Power BI or Tableau
• Data modeling, Measures, Filters
• One dashboard, One question
Example: Sales drop by region and month dashboard

4️⃣ Python
• pandas for cleaning and analysis
• matplotlib or seaborn for quick visuals
Example: Groupby revenue by cohort

5️⃣ Statistics Basics
• Mean vs median, Variance, Correlation
• Know when averages lie
Example: Median salary explains skewed data


SOFT SKILLS (DEAL BREAKERS)

1️⃣ Business Thinking
• Ask why before how
• Tie insights to decisions
Example: High churn points to onboarding gaps

2️⃣ Communication
• Explain insights without jargon
• One slide, One takeaway
Example: Revenue fell due to fewer repeat users

3️⃣ Problem Framing
• Convert vague asks into clear questions
• Define metrics early
Example: What defines an active user?

4️⃣ Attention to Detail
• Validate numbers
• Double check logic
• Small errors kill trust

5️⃣ Stakeholder Handling
• Listen first
• Clarify scope
• Push back with data

🎯 Balance both tech and soft skills to grow faster as an analyst

Double Tap ♥️ For More
  • ❤ 6
Post #2062 1.9K
✅ Power BI Project Ideas for Data Analysts 📊💡

Real-world projects help you stand out in job applications and interviews.

1️⃣ Sales Dashboard
• Track revenue, profit, and sales by region/product
• Add slicers for year, month, category
• Source: Sample Superstore dataset

2️⃣ HR Analytics Dashboard
• Analyze employee attrition, performance, and satisfaction
• KPIs: attrition rate, avg tenure, engagement score
• Use Excel or mock HR dataset

3️⃣ E-commerce Analysis
• Show total orders, AOV (average order value), top-selling items
• Use date filters, category breakdowns
• Optional: add customer segmentation

4️⃣ Financial Report
• Monthly expenses vs income
• Budget variance tracking
• Charts for category-wise breakdown

5️⃣ Healthcare Analytics
• Hospital admissions, treatment outcomes, patient demographics
• Drill-through: see patient-level detail by department
• Public health datasets available online

6️⃣ Marketing Campaign Tracker
• Click-through rates, conversion rates, campaign ROI
• Compare across channels (email, social, paid ads)

🧠 Bonus Tips:
• Use DAX to create measures
• Add tooltips and slicers
• Make the design clean and professional

📌 Practice Task:
Choose one topic → Get a dataset → Build a dashboard → Upload screenshots to GitHub

Power BI Resources: https://whatsapp.com/channel/0029Vai1xKf1dAvuk6s1v22c

💬 Tap ❤️ for more!
  • ❤ 9
Post #2053 1.75K
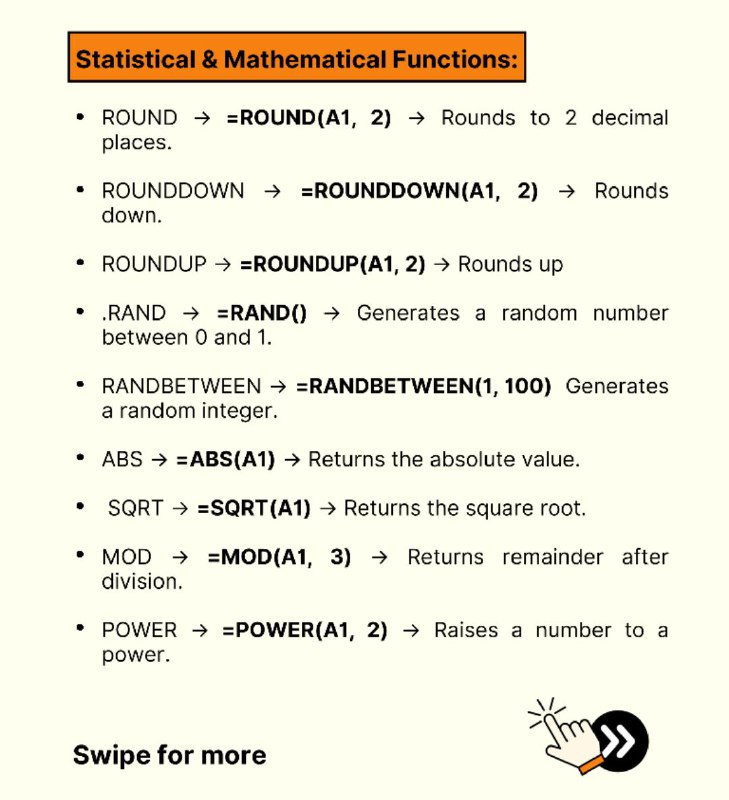
Excel Formulas every data analyst should know
  • ❤ 6
Post #2051 1.51K
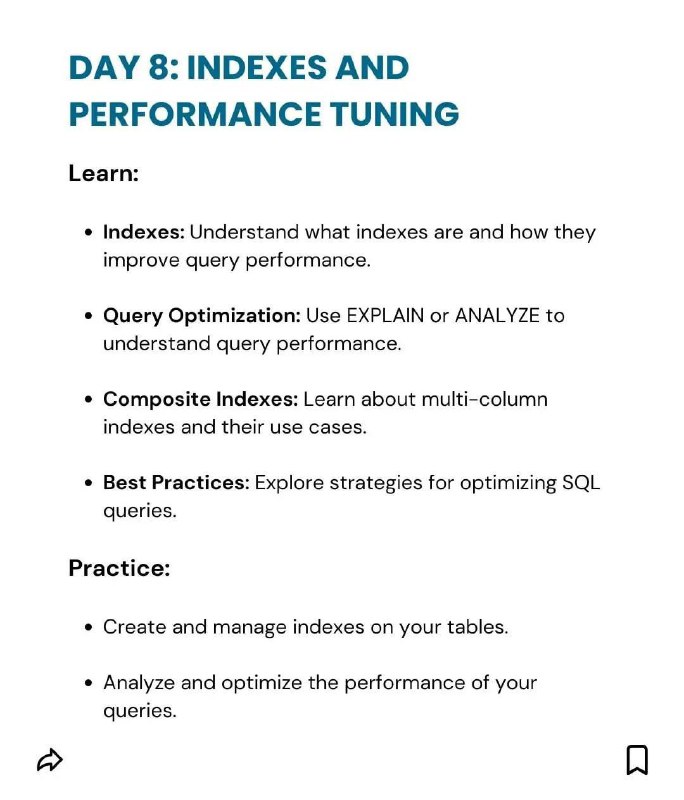
Advanced SQL Optimization Tips for Data Analysts

Use Proper Indexing: Create indexes for frequently queried columns.

Avoid SELECT *: Specify only required columns to improve performance.

Use WHERE Instead of HAVING: Filter data early in the query.

Limit Joins: Avoid excessive joins to reduce query complexity.

Apply LIMIT or TOP: Retrieve only the required rows.

Optimize Joins: Use INNER JOIN over OUTER JOIN where applicable.

Use Temporary Tables: Break complex queries into smaller parts.

Avoid Functions on Indexed Columns: It prevents index usage.

Use CTEs for Readability: Simplify nested queries using Common Table Expressions.

Analyze Execution Plans: Identify bottlenecks and optimize queries.

Here you can find SQL Interview Resources👇
https://whatsapp.com/channel/0029VaGgzAk72WTmQFERKh02

Like this post if you need more 👍❤️

Share with credits: https://t.me/sqlspecialist

Hope it helps :)
  • ❤ 5
  • 🥰 1
Post #2041 1.4K
SQL beginner to advanced level
  • ❤ 3
Older posts →
Threads Profile ViewerView any public Threads profile without an account.Open ThreadLook →Writing with AI? Make it sound human.Metric37 rewrites AI drafts so they read naturally. Free AI detector, 1,500 words free.Try Metric37 →