Join our telegram channel to learn how data analysis can reveal fascinating patterns, trends, and stories hidden within the numbers! 📊
For ads & suggestions: @love_data
Post #1703
1.63K
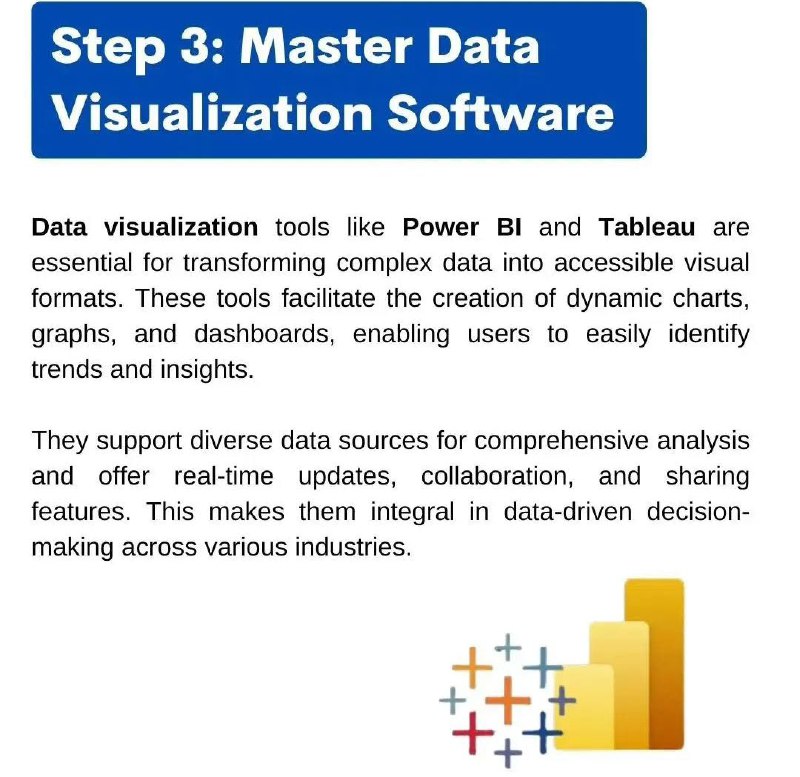
If you want to Excel at Power BI and become a data visualization pro, master these essential features:
• DAX Functions – SUMX(), CALCULATE(), FILTER(), ALL()
• Power Query – Clean & transform data efficiently
• Data Modeling – Relationships, star & snowflake schemas
• Measures vs. Calculated Columns – When & how to use them
• Time Intelligence – TOTALYTD(), DATESINPERIOD(), PREVIOUSMONTH()
• Custom Visuals – Go beyond default charts
• Drill-Through & Drill-Down – Interactive insights
• Row-Level Security (RLS) – Control data access
• Bookmarks & Tooltips – Enhance dashboard storytelling
• Performance Optimization – Speed up slow reports
Like it if you need a complete tutorial on all these topics! 👍❤️
Free Power BI Resources: 👇 https://t.me/PowerBI_analyst
Share with credits: https://t.me/sqlspecialist
Hope it helps :)
• DAX Functions – SUMX(), CALCULATE(), FILTER(), ALL()
• Power Query – Clean & transform data efficiently
• Data Modeling – Relationships, star & snowflake schemas
• Measures vs. Calculated Columns – When & how to use them
• Time Intelligence – TOTALYTD(), DATESINPERIOD(), PREVIOUSMONTH()
• Custom Visuals – Go beyond default charts
• Drill-Through & Drill-Down – Interactive insights
• Row-Level Security (RLS) – Control data access
• Bookmarks & Tooltips – Enhance dashboard storytelling
• Performance Optimization – Speed up slow reports
Like it if you need a complete tutorial on all these topics! 👍❤️
Free Power BI Resources: 👇 https://t.me/PowerBI_analyst
Share with credits: https://t.me/sqlspecialist
Hope it helps :)
- ❤ 5