CryptoBullet$SOL 3D chart $SOL reached its critical Support Zone Imo we’re not gonna break it just yet. Expecting one more bounce/lower high 🎯 Bounce Target - $170-190 Next year the support will break 📉
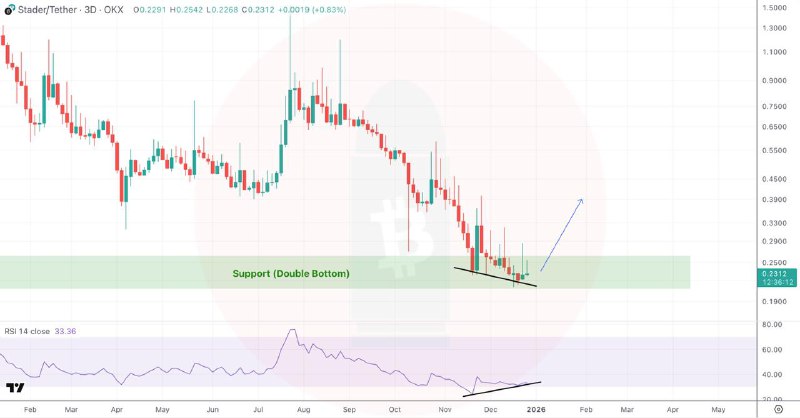
CryptoBullet$SD still holding the Double Bottom Support Finally there's a bullish divergence on RSI Regardless of market conditions, the protocol generates fees which are being used for buybacks
CryptoBullet$SUI vs $TON 🧐 In June 2023 $TON had a crazy flash crash followed by a 50-day decline until it reached the 0.5-0.618 Fib Zone (and then fully recovered) That's exactly what we see on $SUI (and a bunch of other Alts) right now. Next phase is recovery 🎯 Target:…
$SUI vs $TON update
So far so good!
Pulled back into the Support Zone as expected and bounced! 📈
CryptoBulletLet me explain my $40k +/-5k #BTC Bear Market Bottom Target One of the Key indicators that I pay attention to during bear markets is #BTC Realized Price [ Realized Price is value of all coins in circulation at the price they last moved, in other words…
In 2026 we’ll also see #BTC going below the Realized Price (currently sitting at $56k) Keep in mind that in Bear Markets the Realized Price usually slowly declines, so the levels might slightly change.
If we’re gonna repeat the 2022 Bear Market, -33% below the Realized Price would be $37.4k. As I mentioned, the Realized Price will likely decline this year, so by Q3-Q4 in can be at $53-54k and -33% would be around $35k. That’s the lowest I could see #BTC go this year.
As we can see, over the years BTC Volatility has decreased and the distance between the market Price and Realized Price has narrowed: from -66% in 2011 to -33% in 2022
So I believe in 2026 we will have something between -24% & -31% below the Realized Price which means $40-43k
That’s basically how I came up with my $35-45k Bear Market Bottom Target using this on-chain indicator
Let me explain my $40k +/-5k #BTC Bear Market Bottom Target
One of the Key indicators that I pay attention to during bear markets is #BTC Realized Price
[ Realized Price is value of all coins in circulation at the price they last moved, in other words an approximation of what the entire market paid for their coins ]
Every Bear Market #Bitcoin tests the Realized Price level and breaks below it 📉
In 2011 #BTC went -66% below the Realized Price In 2015 #BTC went -48% below the Realized Price In 2018 #BTC went -35% below the Realized Price In 2022 #BTC went -33% below the Realized Price
CryptoBullet#BITCOIN MACRO CHART UPDATE We’ve already spent several MONTHS in my Purple Topping Zone 🟪 🏁 Bull Market Top: $100-130k - DONE! ✅ 😎 4-Year cycle has come to an end. If you’re still holding $BTC, in my opinion it’s time to take profits and prepare for a…
#BITCOIN MACRO CHART | New Cycle
October 2026 - $BTC Bear Market Bottom around $40k 📍
Next Cycle Top in September 2029 between $172-203k 🏁
'If 2025 closes red, does that mean the 4-year cycle is dead? Yearly chart pattern is 3 green 1 red candle'
No, it will just confirm that we're in a Bear Market. The #BTC yearly candle is going to close as a Doji candle at the top - a classic reversal signal. Next year will be deep in the red 🩸
The yearly chart pattern is 3 green 1 red, that's right, and closing 2025 red would break that pattern, but what's more important is that $BTC made a new ATH (Cycle Top) THIS year. So closing the post halving year red is not a problem in this case.
👉 The 4-year cycle is not about the colour of the yearly candles, it's about when we create the Top & the Bottom
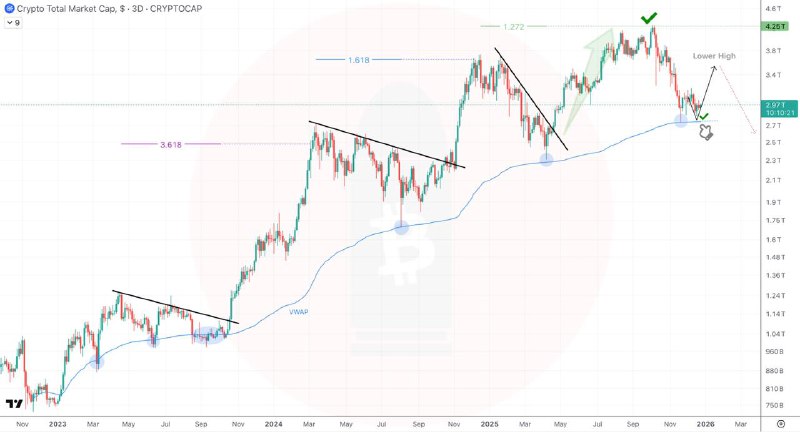
CryptoBullet#TOTAL 3D update Perfectly reached my Target in October ✅👌 And last week we tested the VWAP again 👀 One more test is possible in December and then we’ll have a bigger wave up (Lower High) Eventually, in 2026 we will break below that VWAP, but now I wanna…