TGViewer
Channel Public Channel
SQL Programming Resources

SQL Programming Resources

@sqlanalyst

Find top SQL resources from global universities, cool projects, and learning materials for data analytics.

Admin: @coderfun

Useful links: heylink.me/DataAnalytics

Promotions: @love_data
Subscribers
76.7K
Photos
597
Videos
1
Links
567

Showing posts older than #2419 · Back to latest

Older Posts 20 shown
Post #2418 5.12K
SQL Interview Questions

1. How would you find duplicate records in SQL?
2.What are various types of SQL joins?
3.What is a trigger in SQL?
4.What are different DDL,DML commands in SQL?
5.What is difference between Delete, Drop and Truncate?
6.What is difference between Union and Union all?
7.Which command give Unique values?
8. What is the difference between Where and Having Clause?
9.Give the execution of keywords in SQL?
10. What is difference between IN and BETWEEN Operator?
11. What is primary and Foreign key?
12. What is an aggregate Functions?
13. What is the difference between Rank and Dense Rank?
14. List the ACID Properties and explain what they are?
15. What is the difference between % and _ in like operator?
16. What does CTE stands for?
17. What is database?what is DBMS?What is RDMS?
18.What is Alias in SQL?
19. What is Normalisation?Describe various form?
20. How do you sort the results of a query?
21. Explain the types of Window functions?
22. What is limit and offset?
23. What is candidate key?
24. Describe various types of Alter command?
25. What is Cartesian product?

Like this post if you need more content like this ❤️
  • ❤ 14
  • 👍 1
  • 👏 1
Post #2417 4.71K
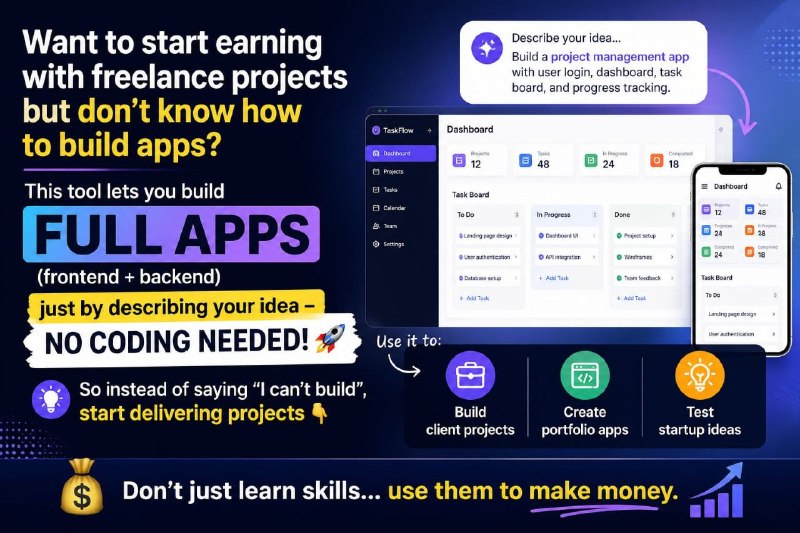
𝗪𝗮𝗻𝘁 𝘁𝗼 𝘀𝘁𝗮𝗿𝘁 𝗲𝗮𝗿𝗻𝗶𝗻𝗴 𝘄𝗶𝘁𝗵 𝗳𝗿𝗲𝗲𝗹𝗮𝗻𝗰𝗲 𝗽𝗿𝗼𝗷𝗲𝗰𝘁𝘀 𝗯𝘂𝘁 𝗱𝗼𝗻’𝘁 𝗸𝗻𝗼𝘄 𝗵𝗼𝘄 𝘁𝗼 𝗯𝘂𝗶𝗹𝗱 𝗮𝗽𝗽𝘀?😍

This tool lets you build FULL apps (frontend + backend) just by describing your idea - NO CODING NEEDED!

So instead of saying “I can’t build”, start delivering projects 👇

https://pdlink.in/4e4ILub

Use it to:
•⁠ ⁠Build client projects
•⁠ ⁠Create portfolio apps
•⁠ ⁠Test startup ideas

Don’t just learn skills… use them to make money.
  • ❤ 5
Post #2416 5.27K
✅ End to End Data Analytics Project Roadmap

Step 1. Define the business problem
Start with a clear question.
Example: Why did sales drop last quarter?
Decide success metric.
Example: Revenue, growth rate.

Step 2. Understand the data
Identify data sources.
Example: Sales table, customers table.
Check rows, columns, data types.
Spot missing values.

Step 3. Clean the data
Remove duplicates.
Handle missing values.
Fix data types.
Standardize text.
Tools: Excel or Power Query SQL for large datasets.

Step 4. Explore the data
Basic summaries.
Trends over time.
Top and bottom performers.
Examples: Monthly sales trend, top 10 products, region-wise revenue.

Step 5. Analyze and find insights
Compare periods.
Segment data.
Identify drivers.
Examples: Sales drop in one region, high churn in one customer segment.

Step 6. Create visuals and dashboard
KPIs on top.
Trends in middle.
Breakdown charts below.
Tools: Power BI or Tableau.

Step 7. Interpret results
What changed?
Why it changed?
Business impact.

Step 8. Give recommendations
Actionable steps.
Example: Increase ads in high margin regions.

Step 9. Validate and iterate
Cross-check numbers.
Ask stakeholder questions.

Step 10. Present clearly
One-page summary.
Simple language.
Focus on impact.

Sample project ideas
• Sales performance analysis.
• Customer churn analysis.
• Marketing campaign analysis.
• HR attrition dashboard.

Mini task
• Choose one project idea.
• Write the business question.
• List 3 metrics you will track.

Example: For Sales Performance Analysis

Business Question: Why did sales drop last quarter?

Metrics:
1. Revenue growth rate
2. Sales target achievement (%)
3. Customer acquisition cost (CAC)

Double Tap ♥️ For More
  • ❤ 15
  • 😍 1
Post #2415 3.87K
🚀 𝗕𝘂𝗶𝗹𝗱 𝗬𝗼𝘂𝗿 𝗢𝘄𝗻 𝗔𝗽𝗽 𝘄𝗶𝘁𝗵 𝗔𝗜 — 𝗡𝗢 𝗖𝗢𝗗𝗜𝗡𝗚 𝗡𝗘𝗘𝗗𝗘𝗗!

Imagine turning your idea into a real app in minutes 🤯

You just describe your idea, and AI builds the entire app for you (frontend + backend + deployment) 💻⚡

💡 Perfect for:
• Students & Beginners , Creators & Side Hustlers & Anyone with an idea 💭

 𝗦𝘁𝗮𝗿𝘁 𝗯𝘂𝗶𝗹𝗱𝗶𝗻𝗴 𝗵𝗲𝗿𝗲👇:-

https://pdlink.in/4e4ILub

💬 Your idea + AI = Your next income source 💸

⚡ Don’t just scroll… BUILD something today!
Post #2414 4.35K
📊 Data Analytics Basics Cheatsheet

1. What is Data Analytics?
Analyzing raw data to find patterns, trends, and insights to support decision-making.

2. Types of Data Analytics:
⦁ Descriptive: What happened?
⦁ Diagnostic: Why did it happen?
⦁ Predictive: What might happen next?
⦁ Prescriptive: What should be done?

3. Key Tools & Languages:
⦁ Excel – Quick analysis & charts
⦁ SQL – Query and manage databases
⦁ Python (Pandas, NumPy, Matplotlib)
⦁ Power BI / Tableau – Dashboards & visualization

4. Data Cleaning Basics:
⦁ Handle missing values
⦁ Remove duplicates
⦁ Convert data types
⦁ Standardize formats

5. Exploratory Data Analysis (EDA):
⦁ Summary stats (mean, median, mode)
⦁ Data distribution
⦁ Correlation matrix
⦁ Visual tools: bar charts, boxplots, scatter plots

6. Data Visualization:
⦁ Use charts to simplify insights
⦁ Choose chart types based on data (line for trends, bar for comparisons, pie for proportions)

7. SQL Essentials:
⦁ SELECT, WHERE, JOIN, GROUP BY, HAVING, ORDER BY
⦁ Aggregate functions: COUNT, SUM, AVG, MAX, MIN

8. Python for Analysis:
⦁ Pandas for dataframes
⦁ Matplotlib/Seaborn for plotting
⦁ Scikit-learn for basic ML models

*9. Metrics to Know:
⦁ Growth %, Conversion rate, Retention rate
⦁ KPIs specific to domain (finance, marketing, etc.)

*10. Real-World Use Cases:
⦁ Customer segmentation
⦁ Sales trend analysis
⦁ A/B testing
⦁ Forecasting demand

💬 Tap ❤️ for more!
  • ❤ 20
Post #2413 4.11K
𝗧𝗵𝗶𝘀 𝗜𝗜𝗧 𝗣𝗿𝗼𝗴𝗿𝗮𝗺 𝗖𝗮𝗻 𝗖𝗵𝗮𝗻𝗴𝗲 𝗬𝗼𝘂𝗿 2026!🎓

Spend your summer inside 𝗜𝗜𝗧 𝗠𝗮𝗻𝗱𝗶 🌄
Not just learning… but actually living the IIT life!

💡 2-Month Residential Program
💻 AI, Data Science, Software Dev & more
🏫 Learn from IIT Faculty + Industry Experts
🛠 Build Real-World Projects
📜 Get IIT Certification

This is NOT an online course.
You stay on campus, learn hands-on & level up your career 🚀

🔥 Perfect for Students, Freshers & Aspiring Tech Professionals

Test Date :- 26th April 

𝗕𝗼𝗼𝗸 𝗬𝗼𝘂𝗿 𝗧𝗲𝘀𝘁 𝗦𝗹𝗼𝘁 𝗡𝗼𝘄 :-👇 :- 
 
https://pdlink.in/41Qze2r

💰 Limited Seats | Applications Open Now
Post #2412 4.48K
🔥 SQL Scenario-Based Q&A (Part 2)
Level up your analyst thinking 👇

📊 Find 2nd highest salary?

👉 Use DENSE_RANK() / ROW_NUMBER()
👉 Or subquery with MAX()
👉 Handle duplicates carefully

📊 Customers who didn’t place any orders?

👉 LEFT JOIN + WHERE order_id IS NULL
👉 Or use NOT EXISTS
👉 Classic anti-join problem

📊 Month-over-Month (MoM) growth?

👉 Use LAG() function
👉 Compare current vs previous month
👉 ((current - prev) / prev) * 100

📊 Pivot rows into columns?

👉 CASE WHEN + aggregation
👉 Or PIVOT (if supported)
👉 Used in reporting

📊 Find highest order per customer?

👉 ROW_NUMBER()
👉 PARTITION BY customer_id
👉 Order by amount DESC

🔥 React ♥️ if you want more SQL like this

🔥 Part 3 coming soon
  • ❤ 9
Post #2411 3.95K
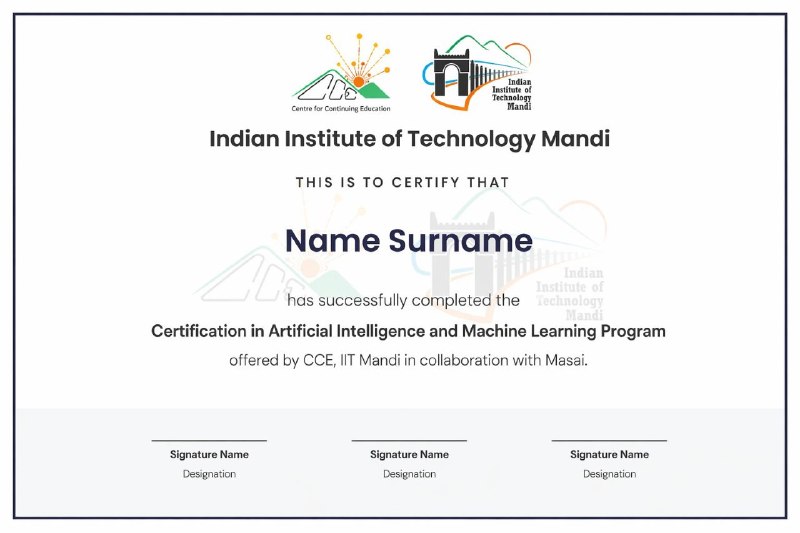
𝗔𝗿𝘁𝗶𝗳𝗶𝗰𝗶𝗮𝗹 𝗜𝗻𝘁𝗲𝗹𝗹𝗶𝗴𝗲𝗻𝗰𝗲 𝗮𝗻𝗱 𝗠𝗮𝗰𝗵𝗶𝗻𝗲 𝗟𝗲𝗮𝗿𝗻𝗶𝗻𝗴 𝗣𝗿𝗼𝗴𝗿𝗮𝗺 𝗯𝘆 𝗖𝗖𝗘, 𝗜𝗜𝗧 𝗠𝗮𝗻𝗱𝗶😍

Freshers get 15 LPA Average Salary with AI & ML Skills!

- Eligibility: Open to everyone
- Duration: 6 Months
- Program Mode: Online
- Taught By: IIT Mandi Professors

90% Resumes without AI + ML skills are being rejected.

🔥Deadline :- 26th April

  𝗔𝗽𝗽𝗹𝘆 𝗡𝗼𝘄👇 :- 

https://pdlink.in/3QSxhjC
.
Get Placement Assistance With 5000+ Companies
  • ❤ 4
Post #2410 3.98K
✅ Data Analysts in Your 20s – Avoid This Career Trap 🚫📊

Don't fall for the passive learning illusion!

🎯 The Trap? → Passive Learning

It feels like you're making progress… but you’re not.

🔍 Example:

You spend hours:
👉 Watching SQL tutorials on YouTube
👉 Saving Excel shortcut threads
👉 Browsing dashboards on LinkedIn
👉 Enrolling in 3 new courses

At day’s end — you feel productive.
But 2 weeks later?
❌ No SQL written from scratch
❌ No real dashboard built
❌ No insights extracted from raw data

That’s passive learning — absorbing, but not applying.
It creates false confidence and delays actual growth.

🛠️ How to Fix It:

1️⃣ Learn by doing: Pick real datasets (Kaggle, public APIs)
2️⃣ Build projects: Sales dashboard, churn analysis, etc.
3️⃣ Write insights: Explain findings like you're presenting to a manager
4️⃣ Get feedback: Share work on GitHub or LinkedIn
5️⃣ Fail fast: Debug bad queries, wrong charts, messy data

📌 In your 20s, focus on building data instincts — not collecting certificates.

Stop binge-learning.
Start project-building.
Start explaining insights.
That’s how analysts grow fast in the real world. 📈

💬 Tap ❤️ if you agree!
  • ❤ 8
Post #2409 3.34K
𝐏𝐚𝐲 𝐀𝐟𝐭𝐞𝐫 𝐏𝐥𝐚𝐜𝐞𝐦𝐞𝐧𝐭 - 𝐆𝐞𝐭 𝐏𝐥𝐚𝐜𝐞𝐝 𝐈𝐧 𝐓𝐨𝐩 𝐌𝐍𝐂'𝐬 😍

Learn Coding From Scratch - Lectures Taught By IIT Alumni

60+ Hiring Drives Every Month

𝐇𝐢𝐠𝐡𝐥𝐢𝐠𝐡𝐭𝐬:- 

🌟 Trusted by 7500+ Students
🤝 500+ Hiring Partners
💼 Avg. Rs. 7.4 LPA
🚀 41 LPA Highest Package

Eligibility: BTech / BCA / BSc / MCA / MSc

𝐑𝐞𝐠𝐢𝐬𝐭𝐞𝐫 𝐍𝐨𝐰👇 :- 

https://pdlink.in/4hO7rWY

Hurry, limited seats available!🏃‍♀️
  • ❤ 1
Post #2408 3.73K
16. What is the difference between INNER JOIN and EXISTS?
- INNER JOIN: returns combined columns from both tables where keys match.
- EXISTS: checks if a subquery returns any rows; usually faster when you only care about existence (e.g., filtering with WHERE EXISTS).


17. What is a FULL OUTER JOIN?
Returns all rows from both tables. If there's no match, unmatched sides are filled with NULL. Useful to see data that exists in either table but not in both.


18. How do you find duplicates across tables?
Use INTERSECT or:
SELECT t1.
FROM table1 t1
WHERE EXISTS (
SELECT 1 FROM table2 t2
WHERE t1.key = t2.key
);
Or use UNION ALL + GROUP BY to count occurrences.


19. What are SQL constraints?
Rules that enforce data integrity:
- PRIMARY KEY, FOREIGN KEY, UNIQUE, NOT NULL, CHECK, DEFAULT.
They keep data consistent and help the query optimizer.


20. Explain GROUPING SETS.

GROUPING SETS lets you define multiple grouping levels in one GROUP BY:

GROUP BY GROUPING SETS (
(), -- grand total
(a), -- by a
(b), -- by b
(a, b) -- by a and b
);
Useful for multi‑level summaries (like OLAP reports).

SQL Programming: https://whatsapp.com/channel/0029VanC5rODzgT6TiTGoa1v

Double Tap ❤️ For More
  • ❤ 5
Post #2407 3.35K
✅ SQL Interview Questions with Answers

1. What is a window function?
A window function computes results over a group ("window") of rows related to the current row, without collapsing them (like GROUP BY).

Examples: ROW_NUMBER(), RANK(), SUM() OVER(...) for running totals, rankings, or moving averages.


2. What is the difference between RANK() and ROW_NUMBER()?
- ROW_NUMBER(): assigns unique sequential numbers to all rows, even if values are equal.
- RANK(): gives same rank to tied values, then skips the next rank (e.g., 1, 1, 3).


3. How do you find the second highest salary?
SELECT salary
FROM (
SELECT salary, DENSE_RANK() OVER (ORDER BY salary DESC) as rnk
FROM employees
) t
WHERE rnk = 2;
This avoids ties if you want exactly the second‑highest value.


4. What is a recursive CTE?
A recursive CTE refers to itself in its WITH definition, usually in the form "anchor + UNION ALL recursive step". It is used for hierarchical data like managers‑employees, org charts, or tree structures.


5. What is the difference between correlated and non-correlated subquery?
- Non‑correlated: runs once, independent of the outer query.
- Correlated: references columns from the outer query and runs once per outer row (e.g., SELECT ... FROM t1 WHERE col > (SELECT AVG(col) FROM t2 WHERE t2.id = t1.id)).


6. How do you remove duplicates without DISTINCT?
Use window functions:
DELETE FROM (
SELECT ROW_NUMBER() OVER (PARTITION BY col1, col2 ORDER BY id) as rn
FROM table
) t
WHERE rn > 1;
Or use GROUP BY and keep one row per group.


7. What is an INDEX and when do you use it?
An index speeds up data retrieval on specified columns (used in WHERE, JOIN, ORDER BY). Use it on columns that are frequently filtered or joined; avoid on very small tables or columns updated often.


8. Explain self-join with example.
A self‑join joins a table to itself using aliases. Example:
SELECT e1.name as employee, e2.name as manager
FROM employees e1
LEFT JOIN employees e2 ON e1.manager_id = e2.id;
Useful for parent‑child relationships.


9. What is the difference between DELETE, DROP, and TRUNCATE?
- DELETE: removes rows (can be filtered by WHERE), can be rolled back.
- TRUNCATE: removes all rows quickly, resets storage; often not logged per row.
- DROP: removes entire table (structure + data); cannot be rolled back.

10. How do you pivot/unpivot data in SQL?
- Pivot: turns rows into columns (e.g., sales per month as columns) using PIVOT or conditional aggregation (MAX(CASE WHEN ... END)).
- Unpivot: turns columns into rows (e.g., multiple month columns → one month column) using UNPIVOT or UNION ALL/VALUES.

11. What is LAG() and LEAD()?
- LAG(col, n): value of col from n rows before current row.
- LEAD(col, n): value from n rows after. Used for time‑series analysis (MoM change, prior/next values).

12. How do you handle NULL in aggregates?
Most aggregates (SUM, AVG, MAX, MIN) ignore NULL.
- COUNT(col) ignores NULL; COUNT() counts all rows.
- Use COALESCE() or ISNULL() to replace NULL before aggregating.

13. What is the difference between VIEW and MATERIALIZED VIEW?
- VIEW: virtual table; query runs every time you select.
- MATERIALIZED VIEW: stores result physically and refreshes periodically; faster reads, slower updates.


14. Explain ACID properties.
- Atomicity: transaction is "all or nothing".
- Consistency: valid state before and after.
- Isolation: concurrent transactions don't interfere.
- Durability: committed changes survive crashes.


15. How do you optimize a slow query?
- Add proper indexes on WHERE, JOIN, ORDER BY columns.
- Remove unnecessary SELECT , DISTINCT, or functions on indexed columns.
- Check execution plan and avoid large scans; use LIMIT or partitioning if possible.
  • ❤ 2
  • 👍 1
Post #2405 3.3K
✅SQL Roadmap: Step-by-Step Guide to Master SQL 🧠💻

Whether you're aiming to be a backend dev, data analyst, or full-time SQL pro — this roadmap has got you covered 👇

📍 1. SQL Basics
⦁  SELECT, FROM, WHERE
⦁  ORDER BY, LIMIT, DISTINCT 
   Learn data retrieval & filtering.

📍 2. Joins Mastery
⦁  INNER JOIN, LEFT/RIGHT/FULL OUTER JOIN
⦁  SELF JOIN, CROSS JOIN 
   Master table relationships.

📍 3. Aggregate Functions
⦁  COUNT(), SUM(), AVG(), MIN(), MAX() 
   Key for reporting & analytics.

📍 4. Grouping Data
⦁  GROUP BY to group
⦁  HAVING to filter groups 
   Example: Sales by region, top categories.

📍 5. Subqueries & Nested Queries
⦁  Use subqueries in WHERE, FROM, SELECT
⦁  Use EXISTS, IN, ANY, ALL 
   Build complex logic without extra joins.

📍 6. Data Modification
⦁  INSERT INTO, UPDATE, DELETE
⦁  MERGE (advanced) 
   Safely change dataset content.

📍 7. Database Design Concepts
⦁  Normalization (1NF to 3NF)
⦁  Primary, Foreign, Unique Keys 
   Design scalable, clean DBs.

📍 8. Indexing & Query Optimization
⦁  Speed queries with indexes
⦁  Use EXPLAIN, ANALYZE to tune 
   Vital for big data/enterprise work.

📍 9. Stored Procedures & Functions
⦁  Reusable logic, control flow (IF, CASE, LOOP) 
   Backend logic inside the DB.

📍 10. Transactions & Locks
⦁  ACID properties
⦁  BEGIN, COMMIT, ROLLBACK
⦁  Lock types (SHARED, EXCLUSIVE) 
   Prevent data corruption in concurrency.

📍 11. Views & Triggers
⦁  CREATE VIEW for abstraction
⦁  TRIGGERS auto-run SQL on events 
   Automate & maintain logic.

📍 12. Backup & Restore
⦁  Backup/restore with tools (mysqldump, pg_dump) 
   Keep your data safe.

📍 13. NoSQL Basics (Optional)
⦁  Learn MongoDB, Redis basics
⦁  Understand where SQL ends & NoSQL begins.

📍 14. Real Projects & Practice
⦁  Build projects: Employee DB, Sales Dashboard, Blogging System
⦁  Practice on LeetCode, StrataScratch, HackerRank

📍 15. Apply for SQL Dev Roles
⦁  Tailor resume with projects & optimization skills
⦁  Prepare for interviews with SQL challenges
⦁  Know common business use cases

💡 Pro Tip: Combine SQL with Python or Excel to boost your data career options.

💬 Double Tap ♥️ For More!
  • ❤ 8
Post #2403 3.59K
✅ Data Analytics Roadmap for Freshers 🚀📊

1️⃣ Understand What a Data Analyst Does
🔍 Analyze data, find insights, create dashboards, support business decisions.

2️⃣ Start with Excel
📈 Learn:
• Basic formulas
• Charts Pivot Tables
• Data cleaning

💡 Excel is still the #1 tool in many companies.

3️⃣ Learn SQL
🧩 SQL helps you pull and analyze data from databases.
Start with:
• SELECT, WHERE, JOIN, GROUP BY

🛠️ Practice on platforms like W3Schools or Mode Analytics.

4️⃣ Pick a Programming Language
🐍 Start with Python (easier) or R
• Learn pandas, matplotlib, numpy
• Do small projects (e.g. analyze sales data)

5️⃣ Data Visualization Tools
📊 Learn:
• Power BI or Tableau
• Build simple dashboards

💡 Start with free versions or YouTube tutorials.

6️⃣ Practice with Real Data
🔍 Use sites like Kaggle or Data.gov
• Clean, analyze, visualize
• Try small case studies (sales report, customer trends)

7️⃣ Create a Portfolio
💻 Share projects on:
• GitHub
• Notion or a simple website

📌 Add visuals + brief explanations of your insights.

8️⃣ Improve Soft Skills
🗣️ Focus on:
• Presenting data in simple words
• Asking good questions
• Thinking critically about patterns

9️⃣ Certifications to Stand Out
🎓 Try:
• Google Data Analytics (Coursera)
• IBM Data Analyst
• LinkedIn Learning basics

🔟 Apply for Internships Entry Jobs
🎯 Titles to look for:
• Data Analyst (Intern)
• Junior Analyst
• Business Analyst

💬 React ❤️ for more!
  • ❤ 12
Post #2402 3.46K
𝗙𝘂𝗹𝗹𝘀𝘁𝗮𝗰𝗸 𝗗𝗲𝘃𝗲𝗹𝗼𝗽𝗺𝗲𝗻𝘁 𝗖𝗲𝗿𝘁𝗶𝗳𝗶𝗰𝗮𝘁𝗶𝗼𝗻 𝗪𝗶𝘁𝗵 𝗚𝗲𝗻𝗔𝗜😍

Curriculum designed and taught by alumni from IITs & leading tech companies, with practical GenAI applications.

* 2000+ Students Placed
* 41LPA Highest Salary
* 500+ Partner Companies
- 7.4 LPA Avg Salary

𝗥𝗲𝗴𝗶𝘀𝘁𝗲𝗿 𝗡𝗼𝘄👇:-

🔹 Online :- https://pdlink.in/4hO7rWY

🔹 Hyderabad :- https://pdlink.in/4cJUWtx

🔹 Pune :-  https://pdlink.in/3YA32zi

🔹 Noida :-  https://linkpd.in/NoidaFSD

Hurry Up 🏃‍♂️! Limited seats are available.
  • ❤ 1
Post #2401 3.5K
🚀 How to Land a Data Analyst Job Without Experience?

Many people asked me this question, so I thought to answer it here to help everyone. Here is the step-by-step approach i would recommend:

✅ Step 1: Master the Essential Skills

You need to build a strong foundation in:

🔹 SQL – Learn how to extract and manipulate data
🔹 Excel – Master formulas, Pivot Tables, and dashboards
🔹 Python – Focus on Pandas, NumPy, and Matplotlib for data analysis
🔹 Power BI/Tableau – Learn to create interactive dashboards
🔹 Statistics & Business Acumen – Understand data trends and insights

Where to learn?
📌 Google Data Analytics Course
📌 SQL – Mode Analytics (Free)
📌 Python – Kaggle or DataCamp


✅ Step 2: Work on Real-World Projects

Employers care more about what you can do rather than just your degree. Build 3-4 projects to showcase your skills.

🔹 Project Ideas:

✅ Analyze sales data to find profitable products
✅ Clean messy datasets using SQL or Python
✅ Build an interactive Power BI dashboard
✅ Predict customer churn using machine learning (optional)

Use Kaggle, Data.gov, or Google Dataset Search to find free datasets!


✅ Step 3: Build an Impressive Portfolio

Once you have projects, showcase them! Create:
📌 A GitHub repository to store your SQL/Python code
📌 A Tableau or Power BI Public Profile for dashboards
📌 A Medium or LinkedIn post explaining your projects

A strong portfolio = More job opportunities! 💡


✅ Step 4: Get Hands-On Experience

If you don’t have experience, create your own!
📌 Do freelance projects on Upwork/Fiverr
📌 Join an internship or volunteer for NGOs
📌 Participate in Kaggle competitions
📌 Contribute to open-source projects

Real-world practice > Theoretical knowledge!


✅ Step 5: Optimize Your Resume & LinkedIn Profile

Your resume should highlight:
✔️ Skills (SQL, Python, Power BI, etc.)
✔️ Projects (Brief descriptions with links)
✔️ Certifications (Google Data Analytics, Coursera, etc.)

Bonus Tip:
🔹 Write "Data Analyst in Training" on LinkedIn
🔹 Start posting insights from your learning journey
🔹 Engage with recruiters & join LinkedIn groups


✅ Step 6: Start Applying for Jobs

Don’t wait for the perfect job—start applying!
📌 Apply on LinkedIn, Indeed, and company websites
📌 Network with professionals in the industry
📌 Be ready for SQL & Excel assessments

Pro Tip: Even if you don’t meet 100% of the job requirements, apply anyway! Many companies are open to hiring self-taught analysts.

You don’t need a fancy degree to become a Data Analyst. Skills + Projects + Networking = Your job offer!

🔥 Your Challenge: Start your first project today and track your progress!

Share with credits: https://t.me/sqlspecialist

Hope it helps :)
  • ❤ 2
Post #2399 4.48K
✅ Complete SQL Roadmap in 2 Months

Month 1: Strong SQL Foundations
Week 1: Database and query basics
- What SQL does in analytics and business
- Tables, rows, columns
- Primary key and foreign key
- SELECT, DISTINCT
- WHERE with AND, OR, IN, BETWEEN
Outcome: You understand data structure and fetch filtered data.

Week 2: Sorting and aggregation
- ORDER BY and LIMIT
- COUNT, SUM, AVG, MIN, MAX
- GROUP BY
- HAVING vs WHERE
- Use case like total sales per product
Outcome: You summarize data clearly.

Week 3: Joins fundamentals
- INNER JOIN
- LEFT JOIN
- RIGHT JOIN
- Join conditions
- Handling NULL values
Outcome: You combine multiple tables correctly.

Week 4: Joins practice and cleanup
- Duplicate rows after joins
- SELF JOIN with examples
- Data cleaning using SQL
- Daily join-based questions
Outcome: You stop making join mistakes.

Month 2: Analytics-Level SQL
Week 5: Subqueries and CTEs
- Subqueries in WHERE and SELECT
- Correlated subqueries
- Common Table Expressions
- Readability and reuse
Outcome: You write structured queries.

Week 6: Window functions
- ROW_NUMBER, RANK, DENSE_RANK
- PARTITION BY and ORDER BY
- Running totals
- Top N per category problems
Outcome: You solve advanced analytics queries.

Week 7: Date and string analysis
- Date functions for daily, monthly analysis
- Year-over-year and month-over-month logic
- String functions for text cleanup
Outcome: You handle real business datasets.

Week 8: Project and interview prep
- Build a SQL project using sales or HR data
- Write KPI queries
- Explain query logic step by step
- Daily interview questions practice
Outcome: You are SQL interview ready.

Practice platforms
- LeetCode SQL
- HackerRank SQL
- Kaggle datasets

Double Tap ♥️ For Detailed Explanation of Each Topic
  • ❤ 16
  • 👍 2
Post #2396 5.21K
✅ Step-by-Step Guide to Create a Data Science Portfolio 🎯📊

✅ 1️⃣ Pick Your Focus Area
Decide what kind of data scientist you want to be:
• Data Analyst → Excel, SQL, Power BI/Tableau 📈
• Machine Learning → Python, Scikit-learn, TensorFlow 🧠
• Data Engineer → Python, Spark, Airflow, Cloud ⚙️
• Full-stack DS → Mix of analysis + ML + deployment 🧑‍💻

✅ 2️⃣ Plan Your Portfolio Sections
Your portfolio should include:
• Home Page – Quick intro about you 👋
• About Me – Education, tools, skills 📝
• Projects – With code, visuals & explanations 📊
• Blog (optional) – Share insights & tutorials ✍️
• Contact – Email, LinkedIn, GitHub, etc. ✉️

✅ 3️⃣ Build the Portfolio Website
Options to build:
• Use Jupyter Notebook + GitHub Pages 🌐
• Create with Streamlit or Gradio (for interactive apps) ✨
• Full site: HTML/CSS or React + deploy on Netlify/Vercel 🚀

✅ 4️⃣ Add 2–4 Quality Projects
Project ideas:
• EDA on real-world datasets 🔍
• Machine learning prediction model 🔮
• NLP app (e.g., sentiment analysis) 💬
• Dashboard in Power BI/Tableau 📈
• Time series forecasting ⏳

Each project should include:
• Problem statement ❓
• Dataset source 📁
• Visualizations 📊
• Model performance ✅
• GitHub repo + live app link (if any) 🔗
• Brief write-up or blog 📄

✅ 5️⃣ Showcase on GitHub
• Create clean repos with README files 🌟
• Add visuals, summaries, and instructions 📸
• Use Jupyter notebooks or Markdown ✏️

✅ 6️⃣ Deploy and Share
• Use Streamlit Cloud, Hugging Face, or Netlify 🚀
• Share on LinkedIn & Kaggle 🤝
• Use Medium/Hashnode for blogs 📝
• Create a resume link to your portfolio 🔗

💡 Pro Tips:
• Focus on storytelling: Why the project matters 📖
• Show your thought process, not just code 🤔
• Keep UI simple and clean ✨
• Add certifications and tools logos if needed 🏅
• Keep your portfolio updated every 2–3 months 🔄

🎯 Goal: When someone views your site, they should instantly see your skills, your projects, and your ability to solve real-world data problems.

💬 Tap ❤️ if this helped you!
  • ❤ 16
  • 👍 1
Post #2394 4.7K
𝗜𝗻𝘁𝗲𝗿𝘃𝗶𝗲𝘄𝗲𝗿: You have 2 minutes to solve this SQL query.

List employees who earn more than their department manager's salary from the employees table (manager_id references employee id).

𝗠𝗲: Challenge accepted!

SELECT e1.name, e1.department, e1.salary
FROM employees e1
JOIN employees e2 ON e1.department = e2.department AND e1.manager_id = e2.id
WHERE e1.salary > e2.salary;

I self-joined the employees table on department and manager_id to compare each employee's salary against their manager's in the same department. The WHERE clause filters for employees earning more. This tests join mastery for hierarchical data, common in org charts.

𝗧𝗶𝗽 𝗳𝗼𝗿 𝗦𝗤𝗟 𝗝𝗼𝗯 𝗦𝗲𝗲𝗸𝗲𝗿𝘀:
Self-joins shine for intra-table relationships like managers/employees or siblings—practice with employee hierarchies to impress in data engineering interviews!

React with ❤️ for more
  • ❤ 5
  • 👍 2
Older posts →
Threads Profile ViewerView any public Threads profile without an account.Open ThreadLook →Writing with AI? Make it sound human.Metric37 rewrites AI drafts so they read naturally. Free AI detector, 1,500 words free.Try Metric37 →