TGViewer
Channel Public Channel
Python for Data Analysts

Python for Data Analysts

@pythonanalyst

Find top Python resources from global universities, cool projects, and learning materials for data analytics.

For promotions: @coderfun

Useful links: heylink.me/DataAnalytics
Subscribers
51.7K
Photos
534
Videos
2
Links
333

Showing posts older than #598 ยท Back to latest

Older Posts 8 shown
Post #597 6.11K
๐—ง๐—ผ๐—ฝ ๐Ÿฑ ๐—™๐—ฟ๐—ฒ๐—ฒ ๐— ๐—ถ๐—ฐ๐—ฟ๐—ผ๐˜€๐—ผ๐—ณ๐˜ ๐—–๐—ผ๐˜‚๐—ฟ๐˜€๐—ฒ๐˜€ ๐—ฌ๐—ผ๐˜‚ ๐—–๐—ฎ๐—ป ๐—˜๐—ป๐—ฟ๐—ผ๐—น๐—น ๐—œ๐—ป ๐—ง๐—ผ๐—ฑ๐—ฎ๐˜†!๐Ÿ˜

In todayโ€™s fast-paced tech industry, staying ahead requires continuous learning and upskillingโœจ๏ธ

Fortunately, ๐— ๐—ถ๐—ฐ๐—ฟ๐—ผ๐˜€๐—ผ๐—ณ๐˜ is offering ๐—ณ๐—ฟ๐—ฒ๐—ฒ ๐—ฐ๐—ฒ๐—ฟ๐˜๐—ถ๐—ณ๐—ถ๐—ฐ๐—ฎ๐˜๐—ถ๐—ผ๐—ป ๐—ฐ๐—ผ๐˜‚๐—ฟ๐˜€๐—ฒ๐˜€ that can help beginners and professionals enhance their ๐—ฒ๐˜…๐—ฝ๐—ฒ๐—ฟ๐˜๐—ถ๐˜€๐—ฒ ๐—ถ๐—ป ๐—ฑ๐—ฎ๐˜๐—ฎ, ๐—”๐—œ, ๐—ฆ๐—ค๐—Ÿ, ๐—ฎ๐—ป๐—ฑ ๐—ฃ๐—ผ๐˜„๐—ฒ๐—ฟ ๐—•๐—œ without spending a dime!โฌ‡๏ธ

๐‹๐ข๐ง๐ค๐Ÿ‘‡:-

https://pdlink.in/3DwqJRt

Start a career in tech, boost your resume, or improve your data skillsโœ…๏ธ
  • โค 1
Post #596 2.4K
๐ˆ๐ฆ๐ฉ๐จ๐ซ๐ญ๐ข๐ง๐  ๐๐ž๐œ๐ž๐ฌ๐ฌ๐š๐ซ๐ฒ ๐‹๐ข๐›๐ซ๐š๐ซ๐ข๐ž๐ฌ:

import pandas as pd
import numpy as np
import matplotlib.pyplot as plt
import seaborn as sns

๐‹๐จ๐š๐๐ข๐ง๐  ๐ญ๐ก๐ž ๐ƒ๐š๐ญ๐š๐ฌ๐ž๐ญ:

df = pd.read_csv('your_dataset.csv')

๐ˆ๐ง๐ข๐ญ๐ข๐š๐ฅ ๐ƒ๐š๐ญ๐š ๐ˆ๐ง๐ฌ๐ฉ๐ž๐œ๐ญ๐ข๐จ๐ง:

1- View the first few rows:
df.head()

2- Summary of the dataset:
df.info()

3- Statistical summary:
df.describe()

๐‡๐š๐ง๐๐ฅ๐ข๐ง๐  ๐Œ๐ข๐ฌ๐ฌ๐ข๐ง๐  ๐•๐š๐ฅ๐ฎ๐ž๐ฌ:

1- Identify missing values:
df.isnull().sum()

2- Visualize missing values:
sns.heatmap(df.isnull(), cbar=False, cmap='viridis')
plt.show()

๐ƒ๐š๐ญ๐š ๐•๐ข๐ฌ๐ฎ๐š๐ฅ๐ข๐ณ๐š๐ญ๐ข๐จ๐ง:

1- Histograms:
df.hist(bins=30, figsize=(20, 15))
plt.show()

2 - Box plots:
plt.figure(figsize=(10, 6))
sns.boxplot(data=df)
plt.xticks(rotation=90)
plt.show()

3- Pair plots:
sns.pairplot(df)
plt.show()

4- Correlation matrix and heatmap:
correlation_matrix = df.corr()
plt.figure(figsize=(12, 8))
sns.heatmap(correlation_matrix, annot=True, cmap='coolwarm')
plt.show()

๐‚๐š๐ญ๐ž๐ ๐จ๐ซ๐ข๐œ๐š๐ฅ ๐ƒ๐š๐ญ๐š ๐€๐ง๐š๐ฅ๐ฒ๐ฌ๐ข๐ฌ:
Count plots for categorical features:

plt.figure(figsize=(10, 6))
sns.countplot(x='categorical_column', data=df)
plt.show()

Python Interview Q&A: https://topmate.io/coding/898340

Like for more โค๏ธ

ENJOY LEARNING ๐Ÿ‘๐Ÿ‘
  • ๐Ÿ‘ 7
  • ๐Ÿ‘ 1
Post #587 2.46K
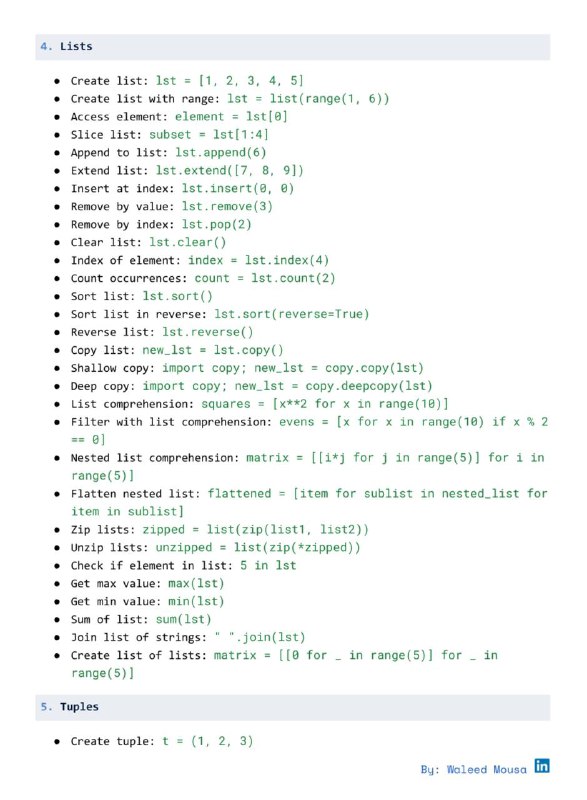
Python Cheatsheet โœ…
  • ๐Ÿ‘ 8
  • โค 1
Post #586 2.12K
๐Ÿฏ๐Ÿฌ ๐— ๐—ผ๐˜€๐˜ ๐—–๐—ผ๐—บ๐—บ๐—ผ๐—ป ๐——๐—ฎ๐˜๐—ฎ ๐—”๐—ป๐—ฎ๐—น๐˜†๐˜๐—ถ๐—ฐ๐˜€ ๐—œ๐—ป๐˜๐—ฒ๐—ฟ๐˜ƒ๐—ถ๐—ฒ๐˜„ ๐—ค๐˜‚๐—ฒ๐˜€๐˜๐—ถ๐—ผ๐—ป๐˜€ ๐—ฌ๐—ผ๐˜‚ ๐— ๐˜‚๐˜€๐˜ ๐—ž๐—ป๐—ผ๐˜„!๐Ÿ˜

Are you preparing for a Data Analytics interview?๐Ÿ—ฃ

Hiring managers often ask a mix of technical & problem-solving questions to evaluate your skills in SQL, Python, Excel, data visualization, & case studies๐ŸŽฏ

๐‹๐ข๐ง๐ค๐Ÿ‘‡:-

https://pdlink.in/4hbmjxf

Which question do you find the toughest? Drop a comment below!โฌ‡๏ธ
  • ๐Ÿ‘ 1
Post #585 2.34K
Important Methods in Pandas Package
  • ๐Ÿ‘ 4
Post #584 2.4K
Pandas Functions for Data Analysis
  • ๐Ÿ‘ 3
Post #577 2.14K
๐Ÿ”ฐ Python Toolkit for Data Analysis
  • ๐Ÿ‘ 4
Older posts โ†’
Threads Profile ViewerView any public Threads profile without an account.Open ThreadLook โ†’Writing with AI? Make it sound human.Metric37 rewrites AI drafts so they read naturally. Free AI detector, 1,500 words free.Try Metric37 โ†’