TGViewer
Channel Public Channel
Python for Data Analysts

Python for Data Analysts

@pythonanalyst

Find top Python resources from global universities, cool projects, and learning materials for data analytics.

For promotions: @coderfun

Useful links: heylink.me/DataAnalytics
Subscribers
51.8K
Photos
534
Videos
2
Links
333

Showing posts older than #1061 ยท Back to latest

Older Posts 13 shown
Post #1059 1.82K
๐ˆ๐ฆ๐ฉ๐จ๐ซ๐ญ๐ข๐ง๐  ๐๐ž๐œ๐ž๐ฌ๐ฌ๐š๐ซ๐ฒ ๐‹๐ข๐›๐ซ๐š๐ซ๐ข๐ž๐ฌ:

import pandas as pd
import numpy as np
import matplotlib.pyplot as plt
import seaborn as sns

๐‹๐จ๐š๐๐ข๐ง๐  ๐ญ๐ก๐ž ๐ƒ๐š๐ญ๐š๐ฌ๐ž๐ญ:

df = pd.read_csv('your_dataset.csv')

๐ˆ๐ง๐ข๐ญ๐ข๐š๐ฅ ๐ƒ๐š๐ญ๐š ๐ˆ๐ง๐ฌ๐ฉ๐ž๐œ๐ญ๐ข๐จ๐ง:

1- View the first few rows:
df.head()

2- Summary of the dataset:
df.info()

3- Statistical summary:
df.describe()

๐‡๐š๐ง๐๐ฅ๐ข๐ง๐  ๐Œ๐ข๐ฌ๐ฌ๐ข๐ง๐  ๐•๐š๐ฅ๐ฎ๐ž๐ฌ:

1- Identify missing values:
df.isnull().sum()

2- Visualize missing values:
sns.heatmap(df.isnull(), cbar=False, cmap='viridis')
plt.show()

๐ƒ๐š๐ญ๐š ๐•๐ข๐ฌ๐ฎ๐š๐ฅ๐ข๐ณ๐š๐ญ๐ข๐จ๐ง:

1- Histograms:
df.hist(bins=30, figsize=(20, 15))
plt.show()

2 - Box plots:
plt.figure(figsize=(10, 6))
sns.boxplot(data=df)
plt.xticks(rotation=90)
plt.show()

3- Pair plots:
sns.pairplot(df)
plt.show()

4- Correlation matrix and heatmap:
correlation_matrix = df.corr()
plt.figure(figsize=(12, 8))
sns.heatmap(correlation_matrix, annot=True, cmap='coolwarm')
plt.show()

๐‚๐š๐ญ๐ž๐ ๐จ๐ซ๐ข๐œ๐š๐ฅ ๐ƒ๐š๐ญ๐š ๐€๐ง๐š๐ฅ๐ฒ๐ฌ๐ข๐ฌ:
Count plots for categorical features:

plt.figure(figsize=(10, 6))
sns.countplot(x='categorical_column', data=df)
plt.show()

Python Interview Q&A: https://topmate.io/coding/898340

Like for more โค๏ธ

ENJOY LEARNING ๐Ÿ‘๐Ÿ‘
  • โค 7
Post #1057 1.98K
Essential Pandas Functions for Data Analysis

Data Loading:

pd.read_csv() - Load data from a CSV file.

pd.read_excel() - Load data from an Excel file.


Data Inspection:

df.head(n) - View the first n rows.

df.info() - Get a summary of the dataset.

df.describe() - Generate summary statistics.


Data Manipulation:

df.drop(columns=['col1', 'col2']) - Remove specific columns.

df.rename(columns={'old_name': 'new_name'}) - Rename columns.

df['col'] = df['col'].apply(func) - Apply a function to a column.


Filtering and Sorting:

df[df['col'] > value] - Filter rows based on a condition.

df.sort_values(by='col', ascending=True) - Sort rows by a column.


Aggregation:

df.groupby('col').sum() - Group data and compute the sum.

df['col'].value_counts() - Count unique values in a column.


Merging and Joining:

pd.merge(df1, df2, on='key') - Merge two DataFrames.

pd.concat([df1, df2]) - Concatenate

Here you can find essential Python Interview Resources๐Ÿ‘‡
https://whatsapp.com/channel/0029VaGgzAk72WTmQFERKh02

Like this post for more resources like this ๐Ÿ‘โ™ฅ๏ธ

Share with credits: https://t.me/sqlspecialist

Hope it helps :)
  • โค 4
Post #1055 1.82K
Your first SQL script will confuse even yourself.

Your first Power BI dashboard will look like it's your first dashboard.

Stop trying to perfect your first handful of projects.

Start pumping out projects left and right.

While learning, it's more important to create than to focus on optimizing.

Quantity > Quality

Once you start getting faster, you'll have more time to swap it to.

Quality > Quantity

You'll improve rapidly this way.
  • โค 7
  • ๐Ÿ‘ 1
Post #1053 1.78K
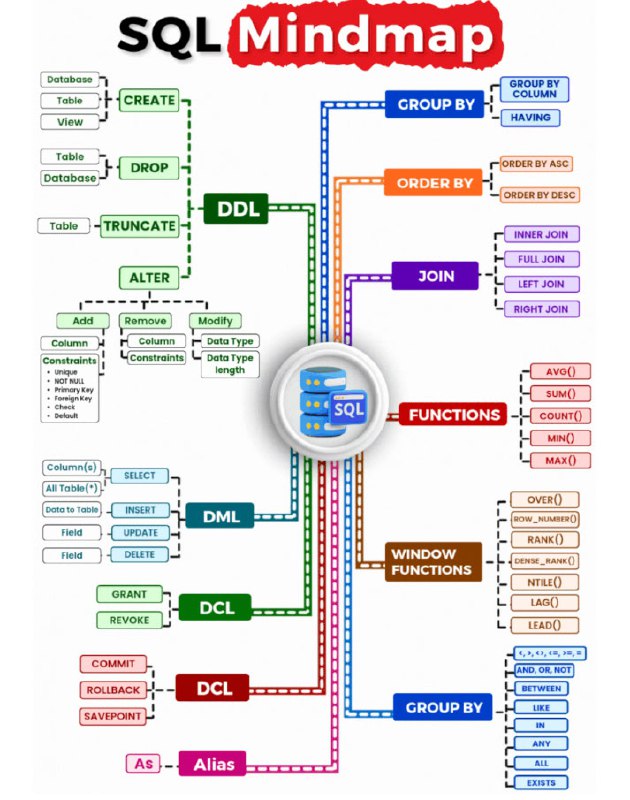
SQL Mindmap
  • โค 4
Post #1046 1.76K
๐Ÿ”ฐ Pygorithm module in Python
  • โค 6
  • ๐Ÿ‘ 2
Post #1043 2.09K
For data analysts working with Python, mastering these top 10 concepts is essential:

1. Data Structures: Understand fundamental data structures like lists, dictionaries, tuples, and sets, as well as libraries like NumPy and Pandas for more advanced data manipulation.

2. Data Cleaning and Preprocessing: Learn techniques for cleaning and preprocessing data, including handling missing values, removing duplicates, and standardizing data formats.

3. Exploratory Data Analysis (EDA): Use libraries like Pandas, Matplotlib, and Seaborn to perform EDA, visualize data distributions, identify patterns, and explore relationships between variables.

4. Data Visualization: Master visualization libraries such as Matplotlib, Seaborn, and Plotly to create various plots and charts for effective data communication and storytelling.

5. Statistical Analysis: Gain proficiency in statistical concepts and methods for analyzing data distributions, conducting hypothesis tests, and deriving insights from data.

6. Machine Learning Basics: Familiarize yourself with machine learning algorithms and techniques for regression, classification, clustering, and dimensionality reduction using libraries like Scikit-learn.

7. Data Manipulation with Pandas: Learn advanced data manipulation techniques using Pandas, including merging, grouping, pivoting, and reshaping datasets.

8. Data Wrangling with Regular Expressions: Understand how to use regular expressions (regex) in Python to extract, clean, and manipulate text data efficiently.

9. SQL and Database Integration: Acquire basic SQL skills for querying databases directly from Python using libraries like SQLAlchemy or integrating with databases such as SQLite or MySQL.

10. Web Scraping and API Integration: Explore methods for retrieving data from websites using web scraping libraries like BeautifulSoup or interacting with APIs to access and analyze data from various sources.

Give credits while sharing: https://t.me/pythonanalyst

ENJOY LEARNING ๐Ÿ‘๐Ÿ‘
  • โค 4
Post #1041 1.89K
If I need to teach someone data analytics from the basics, here is my strategy:

1. I will first remove the fear of tools from that person

2. i will start with the excel because it looks familiar and easy to use

3. I put more emphasis on projects like at least 5 to 6 with the excel. because in industry you learn by doing things

4. I will release the person from the tutorial hell and move into a more action oriented person

5. Then I move to the sql because every job wants it , even with the ai tools you need strong understanding for it if you are going to use it daily

6. After strong understanding, I will push the person to solve 100 to 150 Sql problems from basic to advance

7. It helps the person to develop the analytical thinking

8. Then I push the person to solve 3 case studies as it helps how we pull the data in the real life

9. Then I move the person to power bi to do again 5 projects by using either sql or excel files

10. Now the fear is removed.

11. Now I push the person to solve unguided challenges and present them by video recording as it increases the problem solving, communication and data story telling skills

12. Further it helps you to clear case study round given by most of the companies

13. Now i help the person how to present them in resume and also how these tools are used in real world.

14. You know the interesting fact, all of above is present free in youtube and I also mentor the people through existing youtube videos.

15. But people stuck in the tutorial hell, loose motivation , stay confused that they are either in the right direction or not.

16. As a personal mentor , I help them to get of the tutorial hell, set them in the right direction and they stay motivated when they start to see the difference before amd after mentorship

I have curated best 80+ top-notch Data Analytics Resources ๐Ÿ‘‡๐Ÿ‘‡
https://topmate.io/analyst/861634

Hope this helps you ๐Ÿ˜Š
  • โค 3
Post #1039 1.76K
Post #1037 2.09K
Here are 5 key Python libraries/ concepts that are particularly important for data analysts:

1. Pandas: Pandas is a powerful library for data manipulation and analysis in Python. It provides data structures like DataFrames and Series that make it easy to work with structured data. Pandas offers functions for reading and writing data, cleaning and transforming data, and performing data analysis tasks like filtering, grouping, and aggregating.

2. NumPy: NumPy is a fundamental package for scientific computing in Python. It provides support for large, multi-dimensional arrays and matrices, along with a collection of mathematical functions to operate on these arrays efficiently. NumPy is often used in conjunction with Pandas for numerical computations and data manipulation.

3. Matplotlib and Seaborn: Matplotlib is a popular plotting library in Python that allows you to create a wide variety of static, interactive, and animated visualizations. Seaborn is built on top of Matplotlib and provides a higher-level interface for creating attractive and informative statistical graphics. These libraries are essential for data visualization in data analysis projects.

4. Scikit-learn: Scikit-learn is a machine learning library in Python that provides simple and efficient tools for data mining and data analysis tasks. It includes a wide range of algorithms for classification, regression, clustering, dimensionality reduction, and more. Scikit-learn also offers tools for model evaluation, hyperparameter tuning, and model selection.

5. Data Cleaning and Preprocessing: Data cleaning and preprocessing are crucial steps in any data analysis project. Python offers libraries like Pandas and NumPy for handling missing values, removing duplicates, standardizing data types, scaling numerical features, encoding categorical variables, and more. Understanding how to clean and preprocess data effectively is essential for accurate analysis and modeling.

By mastering these Python concepts and libraries, data analysts can efficiently manipulate and analyze data, create insightful visualizations, apply machine learning techniques, and derive valuable insights from their datasets.

Credits: https://t.me/free4unow_backup

ENJOY LEARNING ๐Ÿ‘๐Ÿ‘
  • โค 3
Post #1035 2.18K
NUMPY CHEATSHEET
  • โค 8
Post #1034 2.13K
  • โค 2
Post #1026 2.01K
List Comprehension in Python
  • โค 5
Older posts โ†’
Threads Profile ViewerView any public Threads profile without an account.Open ThreadLook โ†’Writing with AI? Make it sound human.Metric37 rewrites AI drafts so they read naturally. Free AI detector, 1,500 words free.Try Metric37 โ†’