📊 BTC UPDATE 04/08 – LONG BIAS REMAINS, BUT WAIT FOR THE PULLBACK
BTC is showing stronger bullish momentum compared to previous sessions. After forming a local bottom around 62.3k–62.5k, price rebounded sharply and has reclaimed all of the short-term EMAs on the M15 and M30 timeframes. The EMA20 remains above the EMA50, indicating that short-term bullish momentum is still intact. On the H1 chart, BTC is trading above both the EMA20 and EMA50, while continuing to form higher lows, suggesting that buyers are gradually taking control of the market.
👉 With the current market structure, our preferred strategy is to look for LONG opportunities on pullbacks. However, avoid FOMO by chasing the price after a strong green move.
Whatever you do, do well, and may success attend your efforts.
Wishing everyone a productive day characterized by patience, discipline, and prudent trading decisions. Please remember that while the market will consistently present opportunities, only those who effectively manage risk and maintain consistency will be positioned to capitalize on them. May today afford you clear setups, confident executions, and profitable outcomes. Let us strive to make this Wednesday another successful day together. 📈💪
Trade with intelligence. Maintain discipline. Trust the process.
𝕍𝕀ℙ 𝕊𝕔𝕒𝕝𝕡𝕚𝕟𝕘 𝕊𝕖𝕤𝕤𝕚𝕠𝕟𝕤 🔐LONG BTC MARKET ORD ENTRY 63,655 TP 64,700 SL 62,700 USE 3-5% CAPITALS
WHY WE LONG HERE
- Price pulled back to the long-term EMA (EMA 200) after a strong bullish move and showed a clear reaction, indicating that the EMA 200 was acting as a dynamic support level. - The short-term EMA remained above the medium-term EMA, and the medium-term EMA stayed above the long-term EMA, confirming that the overall bullish trend was still intact at the time of entry. - After testing the EMA 200, a bullish confirmation candle formed, accompanied by a Buy signal (blue arrow), suggesting that the pullback was likely ending and buyers were stepping back in. - The entry at 63,655 was taken immediately after the confirmation candle, targeting the nearby resistance at 64,700, while the stop loss at 62,700 was placed below the support zone and beneath the EMA 200 to limit risk if the bullish structure failed.
However, as the chart later showed, price broke below the EMA 200, and all three EMAs started sloping downward, confirming that the bullish structure had failed. As a result, the LONG setup was invalidated, highlighting the importance of following the stop loss when trading with the 3 EMA strategy.
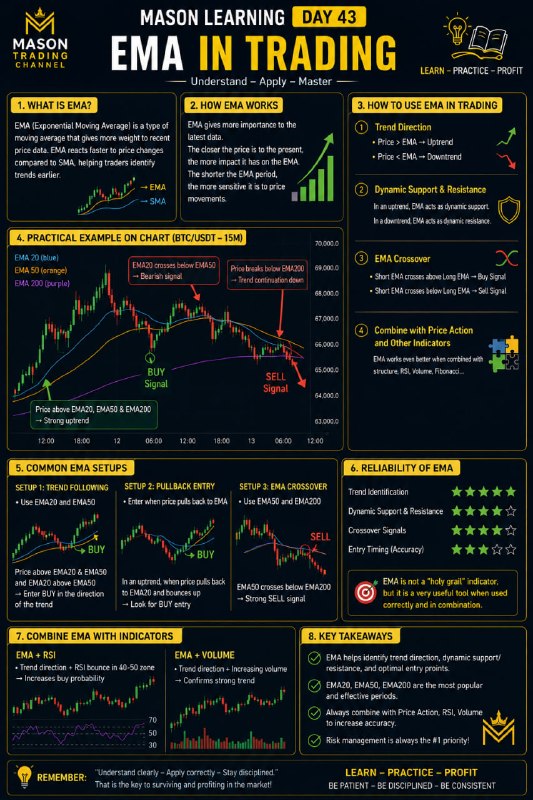
📚 Mason Learning Day 43 – EMA in Trading Today we’re breaking down EMA, how to use it to identify trends, dynamic support/resistance, and potential entry points. 🎯 Simple tool, but powerful when used correctly. Learn – Practice – Profit. 📈
Based on the current market structure, the higher-probability scenario is still to prioritize short positions in line with the prevailing trend.
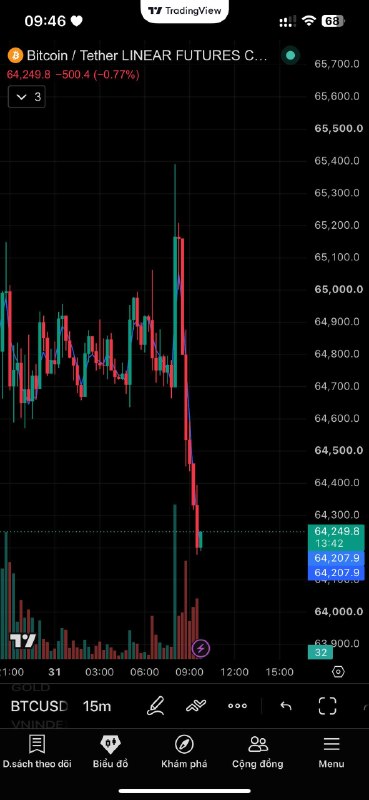
Avoid chasing the move while price is already dropping aggressively. Instead, wait patiently for BTC to retrace into the 64.6k–64.8k resistance zone. If price shows a clear rejection or signs of weakening there, it could provide a higher-probability short entry
📊 BTC UPDATE 31/07 – SELLERS REMAIN IN CONTROL, PRIORITIZE SHORTS WITH THE TREND
BTC has just seen a strong rejection around the 64.8k–65k resistance zone, forming a large bearish candle that completely erased the previous upward move.
On the M15 and M30 timeframes, price has broken below both the EMA20 and EMA50 in a single bearish move, indicating that sellers are firmly in control of the short-term trend.
The H1 timeframe also confirms the weakness, as price continues to be rejected around the EMA200 and has failed to establish a new higher high, suggesting that bullish momentum remains limited.
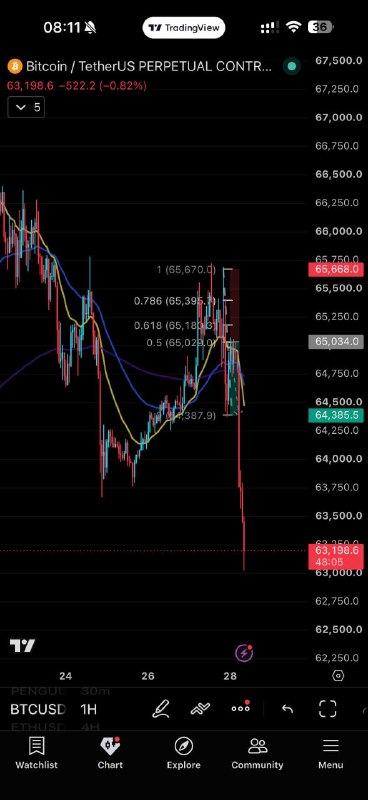
BTC has now confirmed a bearish shift in its short-term market structure, signaling that momentum is no longer favoring the bulls.
Following several failed attempts to sustain price above the rising trendline, sellers regained control and drove BTC below this critical support level. The trendline that had guided the recent uptrend has now been decisively broken.
Current technical signals: ❌ Price is trading below both the EMA20 and EMA50, indicating that bullish momentum has faded. ❌ The sequence of higher highs and higher lows has been broken, confirming a change in market structure. ❌ Bearish momentum is building as buyers continue to lose control of key support areas.
As long as BTC remains beneath the broken trendline and the EMA20/EMA50 resistance zone, the short-term outlook favors the bears. Any relief rally into these resistance levels may provide attractive short opportunities, as long as they align with your trading plan and confirmation signals.
💪 Stay patient and avoid trying to pick the exact bottom. Wait for the market to establish a new bullish structure before considering long positions. Until then, disciplined execution and proper risk management should remain your top priorities.