
🏄♂️BTC(Beyond The Candle) - Technical Analyze (3/18)
(1) Previous Outlook
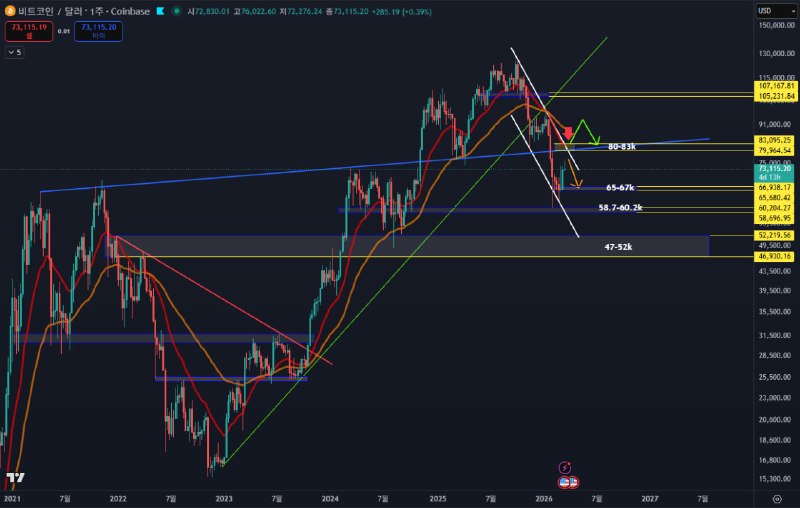
1/ Dec 11 Analysis: The break of the RSI 44 level and the primary uptrend line signaled a total breakdown of the weekly trend. I forecasted a move down to the $58.7k – $60.2k zone.
2/ Jan 13 Analysis: I warned of a weekly 20/50 EMA death cross, indicating further downside potential.
1. BTC Monthly Chart : Downtrend Confirmation & Accumulation Phase
BTC enters a monthly accumulation phase within a broader downtrend. While consolidation is required, shifting fundamentals suggest an accelerated recovery timeline, targeting July 2026 at the earliest
2. BTC Weekly Chart : Relief Rally within Downtrend & $80K–$83K Key Resistance Pivot
The weekly downtrend persists despite the ongoing short-term rally.
The $80k–$83k range is a critical pivot point, and the current short-term rebound is unlikely to break above this level.
BTC(Beyond The Candle) content will be regularly uploaded whenever key indicators are released
✖️ See details @Layergg
#BTC #CHART #FOMC
Post #15265
9.8K

- ❤ 14
- 👍 5
- 🖕 3
- 🔥 2
- 💩 1
- 🤣 1