TGViewer
Channel Public Channel
Glassnode

Glassnode

@glassnode

Institutional Data and Market Intelligence for Digital Assets.

https://studio.glassnode.com/
Subscribers
44K
Photos
1.8K
Videos
1
Links
1.4K

Showing posts older than #70 · Back to latest

Older Posts 20 shown
Post #68 2.65K
Our data shows that a total of 1 billion $USDT (ERC20) was deposited to #Binance in the past two hours.

Note that #Tether has performed a chain swap from Tron to the ERC20 protocol, which effectively leaves the total #USDT supply unchanged.

Live chart | @glassnode
Post #67 2.37K
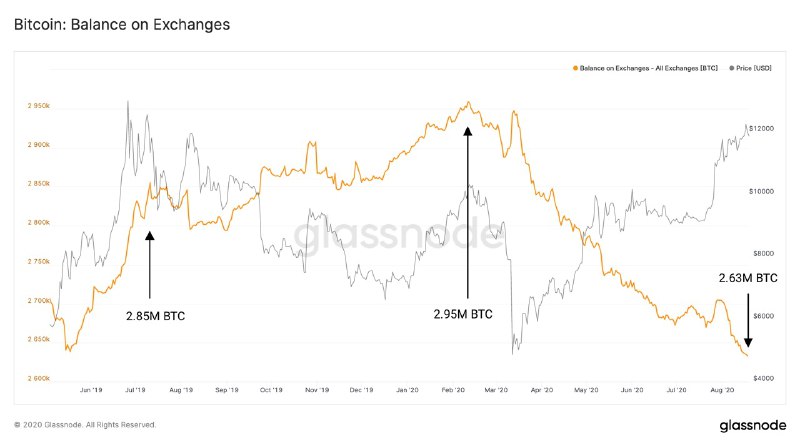
The decline of #Bitcoin exchange balances signals reduced selling pressure.

Currently 2.6M BTC are being held on exchanges.

This is significantly lower than the last time $BTC hit a local top over a year ago (2.8M), and lower than before the sell-off in March (2.9M).

Live chart | @glassnode
Post #66 952
#Bitcoin’s Net Unrealized Profit/Loss (NUPL) broke in to the "Belief" zone for the first time over a year.

Its current value is lower than the last time $BTC hit $12,000 – suggesting potential for more price upside from here.

Live chart | @glassnode
Post #65 901
The compass remains in the bullish quadrant, but #DeFi appears to be receiving more attention than #bitcoin at the moment.

However, with the $12k barrier passed, BTC may soon start to regain dominance in the market.

Read about this week’s developments in the latest Week On-Chain.

Read more | #TheWeekOnChain
Post #64 1.02K
95% of #Bitcoin UTXOs are currently in a state of profit.

Extended periods at this level and above are characteristic of bull runs as BTC moves towards new all-time highs.

Live chart | @glassnode
Post #63 1.45K
Over 17,500 ETH (USD$6.8 million) was spent on fees yesterday on #Ethereum.

As users compete for limited space in the #DeFi ecosystem, arbitrage bots have become unwelcome gas guzzlers, pushing gas prices to all time highs.

Read the full analysis | #Insights
Post #61 1.19K
Despite a drop in GNI, the compass remains safely in the bullish zone as BTC tests the $12k price point.

However, with #Bitcoin on–chain fundamentals slowing slightly, investors should be wary & monitor key metrics.

Read about this week’s developments in the latest Week On-Chain.

Read more | #TheWeekOnChain
Post #60 1.09K
The Market Cap to Thermocap Ratio indicates if an asset is trading at a premium with respect to the total revenue generated by the network (aggregate security spend).

#Bitcoin's current value is still at very low levels – around 5-10x away from previous tops.

Live chart | @glassnode
Post #59 1.4K
Control of #Bitcoin’s supply has been steadily shifting towards smaller entities.

The percent of supply owned by entities holding ≤ 10 $BTC grew from 5.1% to 13.8% in the past five years, while the percent held by entities with 100-100k BTC declined from 62,9% to 49,8%.

Live chart | @glassnode
Post #58 1.06K
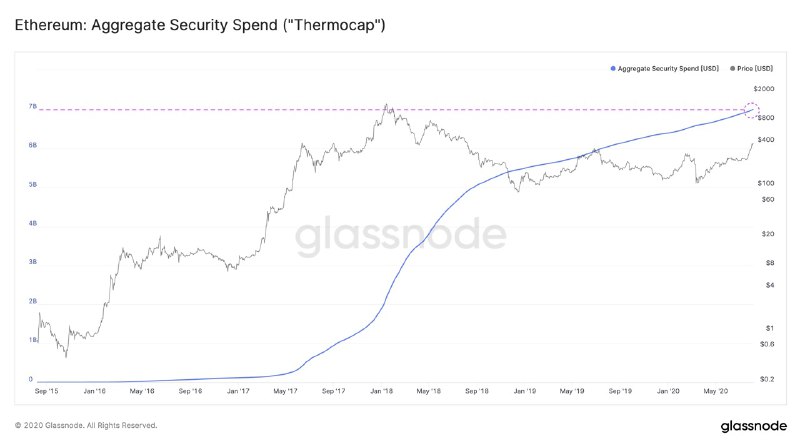
#Ethereum's Aggregate Security Spend ("Thermocap") just reached $7 billion USD.

Thermocap is the total revenue generated by the network (block rewards paid to miners), and can be used as a measure of the true capital flow into Ethereum.

Live chart | @glassnode
Post #57 896
The number of unique entities appearing for the first time in the #Bitcoin network is surging.

This growth rate is the largest we have seen since late 2017.

Live chart | @glassnode
Post #56 842
BTC remained confidently above $10k throughout Week 31, and #Bitcoin's on-chain fundamentals point to the beginning of a potential bull market - but external market forces could still impact this possibility.

Read about this week’s developments in the latest Week On-Chain.

Read more | #TheWeekOnChain
Post #55 815
#Bitcoin UTXO Realized Price Distribution (URPD) is currently highly skewed towards profitability – less than 10% of the BTC supply was last moved at prices above $11,000.

$0 - $1k: 26%
$1k - $7k: 24%
$7k - $10k: 35%
$10k - $11k: 5%
$11k - ATH: 10%

Live chart | @glassnode
Post #54 1.07K
Over 90% of the circulating ETH supply is now in a state of profit, i.e. the current price is higher compared to the price at the time the coins last moved.

Last time this we saw this level was in Feb 2018 when the ETH price was at $925.


Live chart | @glassnode
Post #53 1.11K
In July, 22.2% of ETH miner revenue came from transaction fees.

This is the highest monthly value in #Ethereum's history, and is a continuation of the sharp upwards trend in past three months.

Live chart | @glassnode
Post #52 1.14K
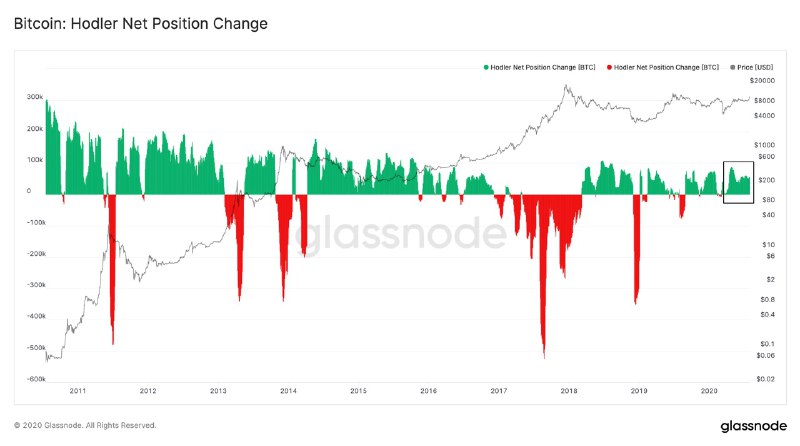
Despite BTC's recent surge to $11k, there are currently no signs of weak hands from long-term investors.

#Bitcoin Hodler Net Position Change remains positive since the end of March, with hodlers currently accumulating more than 50k BTC each month.

Live chart | @glassnode
Post #50 968
Less than halfway from the previous top: #Bitcoin's price drawdown from ATH is currently at -44.1%.

Live chart | @glassnode
Older posts →
Threads Profile ViewerView any public Threads profile without an account.Open ThreadLook →Writing with AI? Make it sound human.Metric37 rewrites AI drafts so they read naturally. Free AI detector, 1,500 words free.Try Metric37 →