TGViewer
Channel Public Channel
Glassnode

Glassnode

@glassnode

Institutional Data and Market Intelligence for Digital Assets.

https://studio.glassnode.com/
Subscribers
44.1K
Photos
1.7K
Videos
1
Links
1.3K

Showing posts older than #640 · Back to latest

Older Posts 20 shown
Post #638 22.6K
#Bitcoin MVRV Ratio is one of the most popular and widely used on-chain metrics. However, much of the power of MVRV is rarely put to use.

The MVRV can be supercharged, and used to find cycle extremes, market trends, and for early warning of cycle peaks.

In our latest research piece, we explore the #Bitcoin MVRV Ratio from several angles:

- Exploring Extreme Values of the MVRV for spotting cycle tops and bottoms.
- MVRV Momentum and how to use the indicator to track macro bull/bear trends.
- Distribution Divergences showing how MVRV often gives advanced warning of cycle tops that are experiencing heavy distribution (sell-side pressure).

Read more in our latest report, and see all live charts in a newly released dashboard
Post #637 27.2K
After the powerful #Bitcoin rally in Jan, several on-chain oscillators have returned to an equilibrium position.

This aligns with observations from previous bear markets, where a turning of the market tides was underway.

Read more in our latest The Week On-chain newsletter
Post #636 30K
Our latest Week On-chain Video report is live.

In this report, we analyze the #Bitcoin rally above $23k from the perspective of:

- Three Waves of Short Squeezes
- Leverage in futures markets
- Spot Exchange $BTC flows
- Average acquisition prices

Watch the latest edition of The Week On-chain
YouTube The Week On-chain: Shorts Squeeze off Spot Demand - Week 5, 2023 (Bitcoin Onchain Analysis) 🐻 Recovering From a Bitcoin Bear Dashboard: https://glassno.de/recoveringbear 🚀 Start your Glassnode Advanced free trial today: https://glassno.de/3QFXu0S 🏦 Exchanges Dashboard: https://glassno.de/3RimWJY 💸 Realized Profit Loss Dashboard: https://glassno.de/3H6c8dz…
Post #635 23.6K
#Bitcoin markets have seen the strongest monthly price performance since Oct-2021.

This rally is fuelled by both spot demand, and a sequence of short squeezes

We explore these dynamics across derivatives markets, and spot exchanges in our latest edition of The Week On-chain.
Post #634 28.3K
There are now over 503k active Proof-of-Stake Validators on the #Ethereum beacon chain.

The total number of new, or exiting validators is capped each day, depending on the validator pool size. The current limit is 1575 validators/day.

📊 Live Proof-of-Stake Dashboard
Post #633 23K
The recent market rally has pushed #Bitcoin prices above $23k, surprising many investors.

However, with higher prices comes an increased motivation for network participants to take exit liquidity, especially after the prolonged bear of 2022

Read more in The Week On-chain Newsletter

Watch our latest Video Report.
Post #632 26K
The total $WBTC Balance wrapped on #Ethereum has declined by over 35% since the collapse of the LUNA/UST project

At the peak, there were 285k #Bitcoin wrapped on #Ethereum, and this has since fallen by 101.55k $WBTC over the course of 2022

📊 Live Chart
Post #631 25.1K
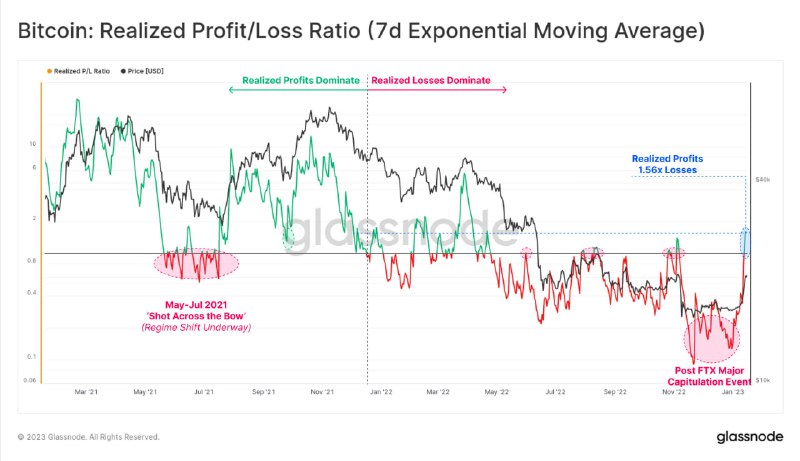
For the first time since June, #Bitcoin has seen a greater volume of Profits realized on-chain than losses.

During bear cycles, this tends to act as a psychological level where investors sell at, or near break-even, creating resistance.

A convincing break above 1.0 for Realized P/L Ratio, or aSOPR has historically signalled a cycle regime shift is underway.

A successful retest and bounce of aSOPR from 1.0 is often observed near cycle turning points.

Read our Full Analysis in The Week On-chain
Post #630 20K
After one of the least volatile months in history, #Bitcoin has seen an explosive rally back above $21k.

In our latest piece, we analyse the rally and the key pricing and valuation models $BTC has broken above.

Read more in The Week On-chain
Post #629 23.2K
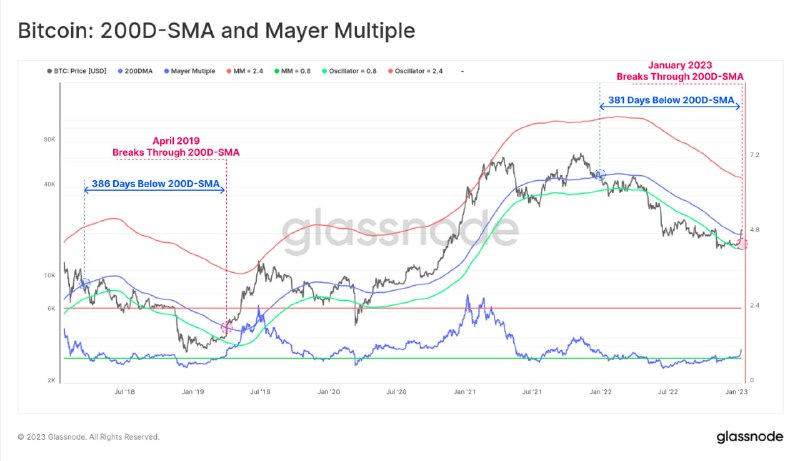
#Bitcoin markets display a fascinating and bizarre level of consistency between cycles.

In the 2018-29 bear, $BTC traded below the 200DMA 🔵 for 386-days.

With last weeks rally, $BTC is back above the 200DMA, having spent 381-days trading below it.

📊Live Chart
Post #628 29.1K
As #Bitcoin rallies to $18.2k, over 13% of the Circulating Supply has returned to profit.

The observed sharp move upwards in this metric helps to confirm that a large volume of $BTC was acquired between $16.5k and $18.2k.

Live Chart
Post #627 24.3K
#Bitcoin and #Ethereum markets opened the new year...by staying asleep.

Realized volatility for the two major assets fell to extreme lows, which has historically preceded explosive moves in either direction

More in our first Week On-chain edition of 2023.
Post #626 33.1K
Our final video report for the year is now live.

We cover:
- Volatility, Derivatives, and leverage
- #Bitcoin on-chain supply concentrations.
- Stress in #Bitcoin mining.
- #Ethereum post-Merge supply dynamics.
- Shifting trends in Stablecoin markets.

Thanks to all our regular watchers and readers of The Week On-chain series. We hope you enjoyed our analysis this year, as much as we enjoy producing it. Wishing you all a very happy holiday season, and our analysis team will be back for another exciting 2023! 🎄

Watch our last video report for 2022.
YouTube The Year On-chain 2022 - Week 50 (Bitcoin Onchain Analysis) As the chaotic, volatile, and financially brutal year of 2022 comes to a close, we explore the state of play across Bitcoin, Ethereum and stablecoin markets. This year in review will be the final edition for the year, and we look forward to returning for…
Post #625 24K
The final edition of The Week On-chain for 2022 is live!

We cover:
- Volatility, derivatives, and leverage.
- Severity of realized losses.
- #Bitcoin on-chain supply concentrations.
- #Ethereum post-Merge supply dynamics.
- Shifting stablecoin dominance

Read more in The Week On-chain.
Post #624 29.2K
Over the last 365-days, a total of $213B in Realized Loss has been locked in by #Bitcoin investors.

This compares to yearly Profits of $455B realized in the 2020-21 bull.

This reflects a relative capital loss of ~47% of the bull market gains, similar in scale to the 2018 cycle.

Live Chart
Post #623 21.2K
Our video report for Week 49 is now also live.

We explore
- The prevailing regime of loss realization by the Bitcoin market.
- All-time-low in Realized P/L Ratio and what it means.
- 17% decline in the Realized cap, returning to May 2021 levels.
- Observations regarding the uptick in on-chain activity.

Watch our video report.
YouTube The Week On-chain: A Capital Reset - Week 49, 2022 (Bitcoin Onchain Analysis) In the wake of one of the largest deleveraging events in digital asset history, the Bitcoin Realized Cap has declined such that all capital inflows since May 2021, have now been flushed out. There is an associated uptick in on-chain activity, however it lacks…
Post #622 18K
In the wake of one of the largest deleveraging events in digital asset history, the #Bitcoin Realized Cap has returned to May 2021 levels.

The Realized Cap decline, and significant realized losses signal that a near complete capital reset has taken place of the speculative premium since the end of the 2021 bull cycle.

Read more in the Week On-chain
Post #621 20.1K
NFTs on #Ethereum accounted for 18% to 22% of transactions during H1-2022.

However NFT dominance has since declined to just 8.3%, as interest in the space wanes during the bear market.

Stablecoin dominance has spiked since FTX from 10% to 12.5%.

Live Chart
Post #620 24.8K
Since the #Ethereum Merge, the total net coin issuance has been just +2,317 $ETH.

A total of 131,454 $ETH has been issued to PoS validators, whilst 129,137 $ETH has been burned via EIP1559.

Live Dashboard
Older posts →
Threads Profile ViewerView any public Threads profile without an account.Open ThreadLook →Writing with AI? Make it sound human.Metric37 rewrites AI drafts so they read naturally. Free AI detector, 1,500 words free.Try Metric37 →