TGViewer
Channel Public Channel
Glassnode

Glassnode

@glassnode

Institutional Data and Market Intelligence for Digital Assets.

https://studio.glassnode.com/
Subscribers
44K
Photos
1.7K
Videos
1
Links
1.3K

Showing posts older than #439 · Back to latest

Older Posts 20 shown
Post #438 22.4K
Happy New Year from Glassnode!

#Bitcoin has had a slow start to 2022, with prices consolidating, and onchain activity barely above bear market trends.

Supply dynamics remain moderately constructive, despite trading below the Short-Term Holder cost basis.

Read our first Week Onchain Newsletter for 2022
Post #437 25.6K
Our last weekly Video Report is live for 2021!

We assess #Bitcoin performance across a number of key metrics, including mining markets, supply dynamics, and derivatives.

Most interesting is the macro flow of $BTC from short-term hands, to patient hands.

Watch out final Video Report for Week 52.
Post #436 22.5K
In our final newsletter for the year, we review the performance of #Bitcoin throughout 2021.

We assess fresh ATH in hash-rate, transfer of $BTC from STHs to LTHs, flow of exchange funds, and a 2x in futures leverage.

Read our analysis in The Week Onchain
Post #435 31.3K
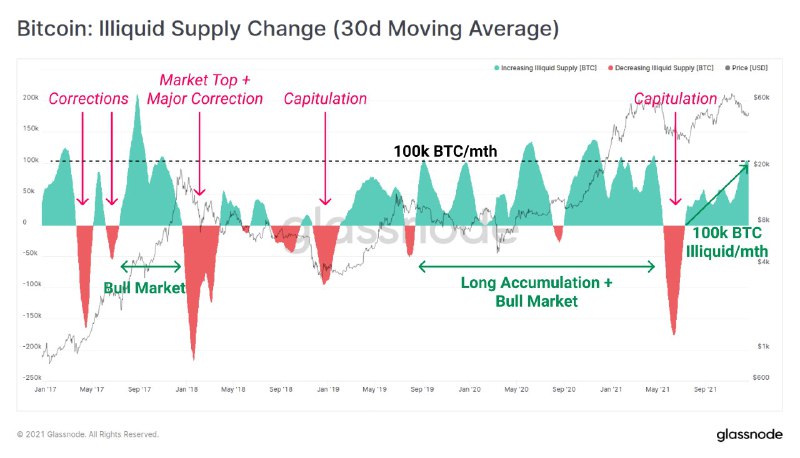
#Bitcoin supply is moving from a Liquid, to Illiquid state at a rate of 100k $BTC per mth.

Illiquid coins are those sent to an address with little history of spending, generally associated with investor accumulation, and bull market buyers.

Live Chart
Post #434 22.8K
#Bitcoin is currently a very top heavy market, with around 24.6% of the total supply held at an unrealized loss.

In this week's Video Report, we analyse various onchain cohorts, to gauge their profitability, and whether they are buying, or selling $BTC.

Watch our Video Report
Post #433 22.3K
#Bitcoin continues to consolidate as macro uncertainty creates weakness across global markets.

In this edition, we assess both Short-, and Long-Term Holder cohorts, and how they are responding to a very top-heavy coin supply

Read more in The Week Onchain
Post #432 22.1K
#Bitcoin miner unspent supply is currently sitting just 500 $BTC below ATH.

These coins are issued to miners as a reward for solving a block, but have never been spent onchain.

Miners started HODLing significantly more $BTC since March 2020.

Live Chart
Post #431 23.3K
#Bitcoin mining difficulty is just 3.5% below the all-time-high.

It has taken 180-days to almost fully recover from 52% of network hash-power going offline during the Great Migration.

Live Chart
Post #430 22.3K
The Canadian #Bitcoin Purpose ETF has added 6,341 $BTC in assets under management since the $69k ATH.

This represents an increase of 26.2% in coin holdings, even whilst prices drawdown over 34% in that time.

Live Chart
Post #429 19.8K
Our video analysis report for Week #50 is live!

We analyse the Bull/Bear line in the sand, in the aftermath of last weeks deleveraging event.

#Bitcoin is on the edge of investor supply profitability, where, historically, the bulls have to step in and provide support.
Post #428 19.4K
The #Bitcoin circulating supply has now passed 18.9M $BTC, which is 90% of the total 21M coins that will ever exist.

It took 12.9yrs to mine the first 90% of the supply, and will take approximately 112yrs to mine the remaining 2.1M $BTC

Live Chart
Post #427 19.6K
The #Bitcoin market hovers precariously below $50k, as the bulls, and bears draw their lines in the sand.

After a significant deleveraging in derivatives markets, onchain data provides insight into the most likely $BTC move.

Read more in The Week Onchain
Post #426 25.8K
#Bitcoin hashrate has almost completely recovered, sitting only 4% below the ATH (7-day moving average basis).

Network hashrate fell by over 50% in May following China's ban on #Bitcoin mining

Hashrate has since climbed by 93% from the lows, hitting 172 Exahash/s today.

Live Chart
Post #425 22.1K
#Bitcoin markets experienced to a sharp decline in prices over the weekend in a large deleveraging.

A key question is whether investor sentiment has been shaken?

in this week's video, we assess the response of both derivatives, and on-chain/spot markets.

Watch our Video Analysis for Week 49
Post #424 20.9K
#Bitcoin markets have experienced another liquidation cascade, with prices falling $8.8k in a single day.

This forced closed over $5.4B worth of futures contracts, in a large scale deleveraging event.

We assess the impact in derivative and spot markets.

Read more in The Week Onchain
Post #423 25.3K
#Bitcoin futures markets have experienced a significant deleveraging event, with over $5.4B in open interest closed yesterday.

Total futures open interest declined from $22B to $16.6B in one day, a decline of 24.5%.

Live Chart
Post #422 21.9K
The #Bitcoin market currently sits in one of the largest realised value clusters.

Over 2.208 Million $BTC have last moved on-chain between $55k and $60k.

The next large cluster between $60k and $63k may act as resistance, whilst support can be found at $50k and again at $42k.
Post #421 20.2K
#Bitcoin futures open interest continues to trade at historically high levels.

A total of $21.9 Billion in futures contract value is currently outstanding.

This reflects a growth of $9.5B (+76.6%) in open interest since the September lows.

Live Chart
Post #420 19.9K
#Bitcoin Average Spent Output Lifespan has returned to a relatively low level of 35-days after peaking in late Oct.

ASOL trends higher as older coins spend, taking profits

During corrections, declining ASOL is a signal investor confidence is improving, and fewer coins are spent

Live Chart
Post #419 18.6K
Over the course of #Bitcoin's life, a staggering $8.89 Trillion in value has been settled on-chain.

We can further breakdown volume by whether it was in profit, or loss:
Volume in Profit = $5.10 Trillion
Volume in Loss = $3.79 Trillion

Live Chart
Older posts →
Threads Profile ViewerView any public Threads profile without an account.Open ThreadLook →Writing with AI? Make it sound human.Metric37 rewrites AI drafts so they read naturally. Free AI detector, 1,500 words free.Try Metric37 →