TGViewer
Channel Public Channel
Glassnode

Glassnode

@glassnode

Institutional Data and Market Intelligence for Digital Assets.

https://studio.glassnode.com/
Subscribers
44.2K
Photos
1.7K
Videos
1
Links
1.3K

Showing posts older than #1687 · Back to latest

Older Posts 14 shown
Post #1686 5.5K
Small caps surged in 2024. Yet raw aggregate market-cap data captured little of the rally.

The reason is structural: when an asset performs well and crosses the $100M threshold, it leaves the small-cap cohort taking its gains with it. The raw series systematically understates small-cap market moves.

As assets appreciate, decline, launch, and disappear, aggregate market analysis beyond price is increasingly difficult.

We just launched Glassnode Global Metrics: a new suite of aggregate metrics and normalized indices for consistent analysis of market-cap cohorts, sectors, and custom asset baskets through time.

Available via API.

Learn more → glassno.de/4uG6dmN
Explore the metrics → glassno.de/3RzjwqN
  • ❤ 6
  • 🔥 3
  • 👀 2
Post #1685 5.13K
At $69.5k, LTH Relative Unrealized Loss sits at 15.5%. For every dollar long-term holders' bags are worth today, they are carrying roughly 15 cents in unrealized loss. At cyclical extremes, that number has exceeded 50 cents on the dollar. Stress is present, but the long-term holder base remains far from the levels of pain that have historically marked cycle lows.

📉 glassno.de/lth-url-loss
  • 👍 14
  • 🔥 3
  • 👏 1
Post #1684 5.05K
US Spot ETF flows have swung back to persistent net outflows, with the 7-day average now near the weakest levels of the cycle.

The shift in flows has coincided with $BTC retracing from $82K to $69K, highlighting materially softer demand.
📉https://glassno.de/3POhzGl
  • 👍 7
Post #1680 5.94K
#BTC trades at $71.3K under growing pressure. Sellers dominate spot, ETF outflows accelerate to $1.3B, and fresh capital has stalled. Structure has broken and momentum favours the downside near-term.

Read this week’s Market Pulse👇
https://glassno.de/4nXysLe
  • ❤ 12
  • 👀 4
  • 🔥 2
  • 😍 2
Post #1678 6.94K
The Week On-Chain 21, 2026
Stalling at the Threshold

#BTC pushes beyond $80K toward key resistance near $85K, with bulls in control. ETF demand builds and shorts persist, but overhead supply may cap upside without stronger spot follow-through.


Executive Summary

- Bitcoin is consolidating within the $75k–$78k range, with the Short-Term Holder Cost Basis and True Market Mean converging near $78k, creating a top-heavy structure where a sustained hold above the True Market Mean is required to support a pre-bull market transition.


- Spot demand remains directionless despite improving price action, with Spot Volume Delta holding near neutral and BTC recently reclaiming the $110K region, suggesting buying interest is stabilising but conviction remains limited.


- Implied volatility continues to compress across the curve as realized volatility trends lower, reinforcing calmer short term conditions and supportive carry for volatility sellers.


Read the full Week On-Chain
  • ❤ 12
  • ✍ 5
  • 👍 2
Post #1677 5.8K
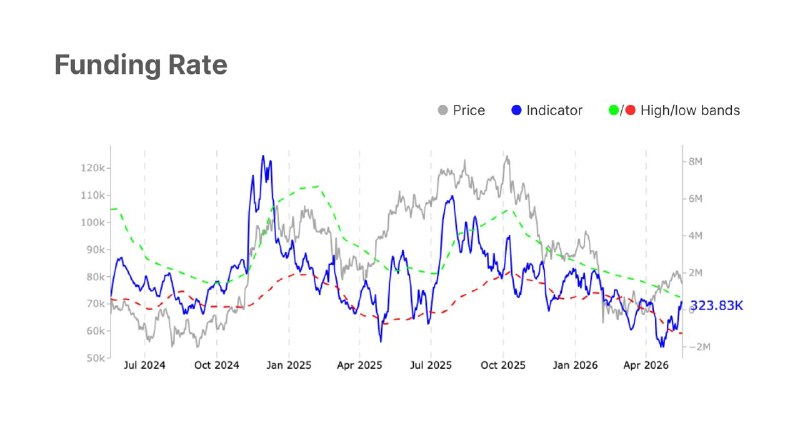
Funding rates have flipped decisively positive again, with traders increasingly paying a premium to maintain long exposure as $BTC consolidates near the mid-$70Ks.

The move marks a sharp reversal from April’s heavily short-biased positioning.
📈glassno.de/4wLHSNT
  • 👍 11
  • ❤ 6
  • 🙈 1
  • 🙉 1
Post #1673 6.58K
#Bitcoin pulled back from $79K to $74K before rebounding toward $77K, with momentum and activity cooling. Despite softer sentiment, easing sell pressure hints at early signs of stabilization.

Read this week’s Market Pulse👇
https://glassno.de/4nQerGs
  • 👍 8
  • ❤ 7
  • 🔥 1
Post #1672 6.1K
Since May 7, US Spot ETFs have recorded net outflows on nearly every trading day, a persistent institutional sell signal now running for more than two weeks.

This steady drip of outflow continues to add to the supply side without a visible demand offset.

📉http://glassno.de/43yFdJX
  • 👍 7
  • ❤ 2
  • 🔥 2
Post #1671 5.77K
Directional strategies posted their strongest month of the year as market-neutral books continued to quietly compound gains.

Across a survey of 400+ managers, every major digital asset sub-strategy delivered positive average returns in April — a level of alignment not seen in recent memory.

Read all the insights in the latest edition of Strategy Watch now live: glassno.de/3RqzSSn

Inside the new edition:

▪️ Every major crypto hedge fund sub-strategy finished positive in April

▪️ A deep dive into DeFi/Yield strategies, featuring a CIO’s perspective on where edge comes from as lending spreads compress and smart contract risk evolves

▪️ How 400+ managers are positioning for Q2, with cash levels climbing despite a more constructive market backdrop

▪️ The latest allocator activity across tokenized funds, BTC treasury strategies, and institutional on-chain yield vehicles.

Produced in collaboration with Crypto Insights Group.

Subscribe at glassno.de/4dzrjvW
  • 👍 6
  • 🔥 5
  • ❤ 3
Post #1670 5.07K
Which coins are currently exposed to quantum risk at rest?

In our latest research, we quantify Bitcoin’s exposed supply and separate exposure into two categories:

Structural exposure: 1.92M BTC (9.6%) coins exposed by design
Operational exposure: 4.12M BTC (20.6%) linked to wallet behavior, address reuse, and custody practices.

▷ The larger share is operational, suggesting that part of Bitcoin’s visible exposure may still be reduced through improved wallet and custody management.

▷ Exchange-related balances alone account for 1.63M BTC (8.1% of issued supply).

Read all findings 👉 glassno.de/4v2wdJ1
  • 👏 11
  • ❤ 5
  • 👻 1
Post #1669 4.78K
BTC remains structurally resilient, but weakening spot demand, slowing ETF inflows, and increasingly crowded long positioning suggest upside momentum is cooling down.

Executive Summary
- BTC reclaimed True Market Mean at $78.3k but couldn't hold. History suggests weeks to months of consolidation needed before a bull transition.
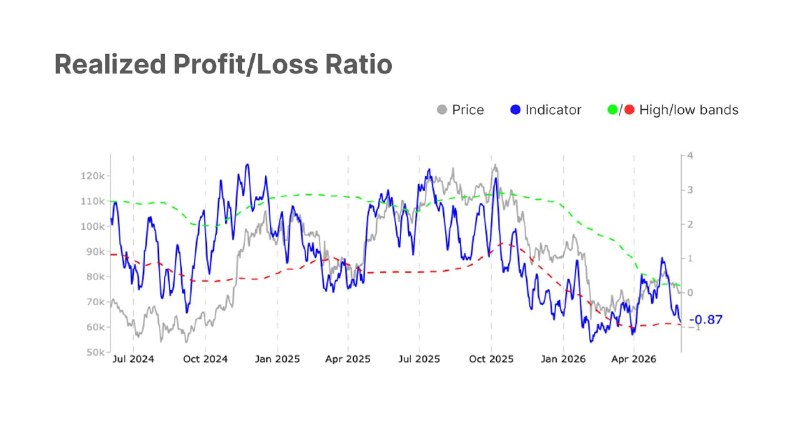
- 30D SMA of Realized P/L Ratio jumped from 0.4 to 1.8 during the rally. Needs a sustained move above 2 to confirm real buy-side recovery.
- 30D cost basis at $78.2k flipped from support to resistance. The Feb-April cohort at $71.4k is the next support floor.
- Spot internals have weakened. Aggregate Spot CVD stays negative and Coinbase lags, pointing to softer US institutional demand.
- CME Futures OI keeps recovering with price, showing better institutional participation in derivatives.
- US Spot ETF inflows are slowing, leaving futures to drive positioning as spot demand fades.
- Options positioning stays defensive. Skew shows demand for downside hedges.

glassno.de/43lYUEO
  • ❤ 6
  • 👍 4
  • 🔥 1
Post #1668 5.83K
As IBIT options continue to grow, they offer new insight into institutional risk pricing, hedging activity, and positioning.

We just expanded coverage to IBIT options, bringing Glassnode's institutional-grade options market intelligence to the largest US spot Bitcoin ETF.

40+ new metrics available, including:

- OI & Volume
- ATM Implied Volatility
- Proprietary Skew metrics
- IV heatmaps

Use IBIT options data to:

→ Measure institutional sentiment
→ Compare TradFi and crypto-native positioning
→ Monitor hedging activity around macro events and drawdowns
→ Track volatility risk across tenors

📖 Read launch article glassno.de/4eWucJx
📊 Explore the new metrics glassno.de/499a0R5
  • 🔥 12
  • 👏 6
  • ❤ 1
  • 🤯 1
Post #1664 6.74K
$BTC
rolled over from a local peak above $82K into the mid-$76Ks, with spot demand, ETF flows, and speculative positioning weakening. Long-term holder strength remains a key source of support.

Read this week’s Market Pulse👇
https://glassno.de/4nzZuIp
  • ❤ 13
  • 👍 11
  • ✍ 2
Older posts →
Threads Profile ViewerView any public Threads profile without an account.Open ThreadLook →Writing with AI? Make it sound human.Metric37 rewrites AI drafts so they read naturally. Free AI detector, 1,500 words free.Try Metric37 →