TGViewer
Channel Public Channel
Data science/ML/AI

Data science/ML/AI

@datascience_bds

Data science and machine learning hub

Python, SQL, stats, ML, deep learning, projects, PDFs, roadmaps and AI resources.

For beginners, data scientists and ML engineers
πŸ‘‰ https://rebrand.ly/bigdatachannels

DMCA: @disclosure_bds
Contact: @mldatascientist
Subscribers
14K
Photos
609
Videos
7
Links
341

Showing posts older than #1268 Β· Back to latest

Older Posts 20 shown
Post #1264 1.79K
β–ŽCommon Data Visualization Terms

1. Data Visualization: The graphical representation of information and data, using visual elements like charts, graphs, and maps to make complex data more accessible and understandable.

2. Chart: A visual representation of data, often used to display relationships between variables or trends over time; common types include bar charts, line charts, and pie charts.

3. Graph: A diagram that represents data points and their relationships, typically using axes to plot values; can include various forms like scatter plots and network graphs.

4. Dashboard: An interactive interface that consolidates and visualizes key performance indicators (KPIs) and metrics in one place, allowing users to monitor data at a glance.

5. Heatmap: A graphical representation of data where individual values are represented as colors, often used to show the intensity of data points across two dimensions.

6. Scatter Plot: A type of graph that uses dots to represent the values of two different numeric variables, allowing for the visualization of relationships or correlations.

7. Bar Chart: A chart that presents categorical data with rectangular bars, where the length of each bar is proportional to the value it represents.

8. Line Chart: A type of chart that displays information as a series of data points called 'markers' connected by straight line segments, commonly used to show trends over time.

9. Pie Chart: A circular statistical graphic divided into slices to illustrate numerical proportions; each slice represents a category's contribution to the whole.

10. Legend: An explanatory key that describes the symbols, colors, or patterns used in a chart or graph, helping viewers understand what each element represents.

11. Axis: A reference line in a chart or graph that defines the scale and direction of the data being represented; typically includes both x-axis (horizontal) and y-axis (vertical).

12. Annotation: Additional information or commentary added to a chart or graph to provide context or highlight specific data points or trends.

13. Data Point: An individual value or observation in a dataset, often represented visually in charts or graphs.

14. Trend Line: A line superimposed on a chart that indicates the general direction or trend of the data points, often used in time series analysis.

15. Outlier: A data point that significantly differs from other observations in a dataset, which can skew analysis and visualization results.

16. Histogram: A graphical representation of the distribution of numerical data, showing the frequency of data points within specified ranges (bins).

17. Box Plot (Box-and-Whisker Plot): A standardized way of displaying the distribution of data based on a five-number summary (minimum, first quartile, median, third quartile, maximum).

18. Facet Grid: A grid layout that displays multiple subplots based on different categories or variables, allowing for comparison across various segments of the data.

19. Sankey Diagram: A flow diagram that visualizes the flow of resources or information between entities, with arrows representing quantities and their relationships.

20. Interactive Visualization: Visual representations that allow users to engage with the data through actions like zooming, filtering, or hovering to obtain more information, enhancing user experience and insight discovery.
  • ❀ 6
Post #1263 1.56K

Forwarded from Free Programming Books

statistical-analysis-of-networks.pdf9.3 MB
πŸ“˜Statistical Analysis of Networks

✍️ Authors: Konstantin Avrachenkov, Maximilien Dreveton

πŸ—“ Year: 2022

πŸ“„ Pages: 237

🧠 This open book is a general introduction to the statistical analysis of networks, and can serve both as a research monograph and as a textbook. Numerous fundamental tools and concepts needed for the analysis of networks are presented, such as network modeling, community detection, graph-based semi-supervised learning and sampling in networks. As prerequisites for reading this book, a basic knowledge in probability, linear algebra and elementary notions of graph theory is advised. 

#StatisticalAnalysis
────────────────────
πŸ‘‰ @free_programming_books_bds πŸ‘ˆ
  • ❀ 9
  • πŸ‘ 1
Post #1261 1.8K
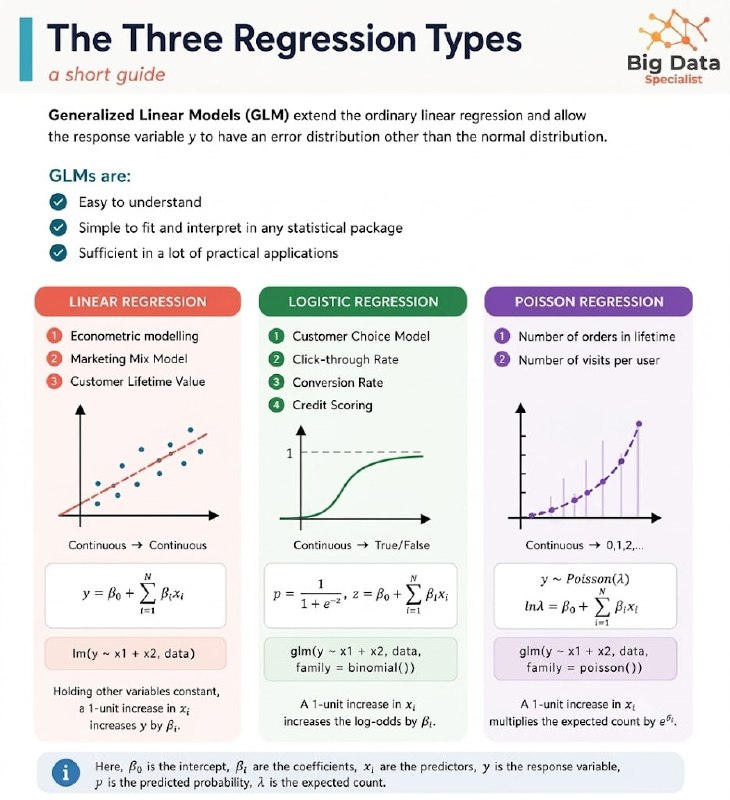
The 3 Regression Types: Short Guide
  • ❀ 5
Post #1259 5.35K
Data science/ML/AI Hey folks! I've been a bit absent lately for a few reasons, one of them being the birth of my son 😁 I'm currently on vacation and getting back to the free Data Science course we discussed earlier. I'll also be catching up on your requests, including the one…
Pandas Data Cleaning Guide - Big Data Specialist.pdf1.7 MB
Here it is, Pandas Data Cleaning guide❗️

It's requested yesterday, and 24h later PDF with detailed explanation and examples is created βœ…

What's inside:
The Basics
01 Why Data Cleaning Matters
02 First Look - Exploring Your DataFrame
03 Handling Missing Values (NaN)

Data Types and Structure
04 Data Types and Type Casting
05 Strings and Text Cleaning
06 Duplicates and Index Resetting

Advanced Techniques
07 Outliers - Detection and Handling
08 Reshaping and Merging DataFrames
09 Common Mistakes to Avoid
10 Pro Tips and Tricks

If you have any more requests let me know in comments/discussion group.

If you liked PDF I created or appreciate my effort, show me some love ❀️

@datascience_bds πŸ™Œ
  • ❀ 8
Post #1258 1.67K
β–ŽKey Concepts in Data Science

Data science is a multidisciplinary field that combines statistics, computer science, and domain knowledge to extract insights and knowledge from structured and unstructured data. Here are some key concepts in data science:

β–Ž1. Data Collection

β€’ Data Sources: Data can be collected from various sources, including databases, APIs, web scraping, surveys, and sensors.
β€’ Data Types: Understanding the types of data (e.g., structured, unstructured, semi-structured) is crucial for determining the appropriate analysis methods.

β–Ž2. Data Cleaning and Preprocessing

β€’ Data Cleaning: Involves removing errors, duplicates, and inconsistencies in the data. This step is critical as dirty data can lead to incorrect conclusions.
β€’ Data Transformation: Techniques such as normalization, scaling, and encoding categorical variables are used to prepare data for analysis.

β–Ž3. Exploratory Data Analysis (EDA)

β€’ Descriptive Statistics: Summarizing the main features of a dataset using measures such as mean, median, mode, variance, and standard deviation.
β€’ Data Visualization: Using visual tools like histograms, scatter plots, box plots, and heatmaps to understand data distributions and relationships.

β–Ž4. Statistical Inference

β€’ Hypothesis Testing: A method to determine whether there is enough evidence to reject a null hypothesis. Common tests include t-tests, chi-square tests, and ANOVA.
β€’ Confidence Intervals: A range of values that is likely to contain the population parameter with a specified level of confidence.

β–Ž5. Machine Learning

β€’ Supervised Learning: Involves training a model on labeled data to predict outcomes. Common algorithms include linear regression, decision trees, and support vector machines.
β€’ Unsupervised Learning: Used for finding hidden patterns in unlabeled data. Techniques include clustering (e.g., K-means) and dimensionality reduction (e.g., PCA).
β€’ Reinforcement Learning: A type of learning where an agent learns to make decisions by taking actions in an environment to maximize cumulative reward.

β–Ž6. Model Evaluation

β€’ Performance Metrics: Evaluating model performance using metrics such as accuracy, precision, recall, F1-score, and ROC-AUC for classification tasks; RMSE and MAE for regression tasks.
β€’ Cross-Validation: A technique for assessing how the results of a statistical analysis will generalize to an independent dataset. K-fold cross-validation is a common method.

β–Ž7. Feature Engineering

β€’ Feature Selection: The process of selecting a subset of relevant features for model training to improve performance and reduce overfitting.
β€’ Feature Creation: Generating new features from existing ones (e.g., combining variables or extracting date components) to enhance model performance.

β–Ž8. Deployment and Monitoring

β€’ Model Deployment: The process of integrating a machine learning model into production so it can make predictions on new data.
β€’ Monitoring: Continuous tracking of model performance over time to ensure it remains accurate and relevant. This may involve retraining the model with new data.

β–Ž9. Big Data Technologies

β€’ Distributed Computing: Tools like Apache Hadoop and Apache Spark that allow processing large datasets across clusters of computers.
β€’ Data Storage Solutions: Understanding different storage solutions such as relational databases (SQL), NoSQL databases (MongoDB), and data lakes.

β–Ž10. Ethics in Data Science

β€’ Bias and Fairness: Recognizing and mitigating bias in data and algorithms to ensure fair outcomes.
β€’ Privacy Concerns: Ensuring compliance with regulations like GDPR and CCPA when handling personal data.
  • ❀ 6
Post #1257 1.46K
Hey folks! I've been a bit absent lately for a few reasons, one of them being the birth of my son 😁

I'm currently on vacation and getting back to the free Data Science course we discussed earlier. I'll also be catching up on your requests, including the one just asked by our group member (image above).

Feel free to send over anything you'd like help with while I'm off work. I'll have some extra time and will do my best to help!
  • ❀ 7
Post #1256 1.58K
Linear Regression
  • ❀ 5
  • πŸ‘ 1
Post #1253 1.8K
Logistic Regression
  • ❀ 8
  • πŸ‘ 3
Post #1250 1.81K
β–ŽCommon AI Terms

1. Artificial Intelligence (AI): The simulation of human intelligence processes by machines, particularly computer systems, encompassing learning, reasoning, and self-correction.

2. Machine Learning (ML): A subset of AI that focuses on the development of algorithms that allow computers to learn from and make predictions or decisions based on data.

3. Deep Learning: A specialized area of machine learning that uses neural networks with many layers (deep neural networks) to model complex patterns in large datasets.

4. Natural Language Processing (NLP): A field of AI that enables computers to understand, interpret, and generate human language in a meaningful way.

5. Computer Vision: A field of AI that enables machines to interpret and make decisions based on visual data from the world, such as images and videos.

6. Reinforcement Learning: A type of machine learning where an agent learns to make decisions by taking actions in an environment to maximize cumulative reward.

7. Supervised Learning: A machine learning approach where a model is trained on labeled data, meaning that the input data is paired with the correct output.

8. Unsupervised Learning: A machine learning approach where a model is trained on unlabeled data, allowing it to find patterns or groupings within the data without explicit guidance.

9. Semi-Supervised Learning: A hybrid approach that uses both labeled and unlabeled data for training, improving learning accuracy when labeled data is scarce.

10. Feature Engineering: The process of selecting, modifying, or creating features (input variables) from raw data to improve the performance of machine learning models.

11. Overfitting: A modeling error that occurs when a model learns the training data too well, capturing noise and outliers, which negatively impacts its performance on new data.

12. Underfitting: A situation where a model is too simple to capture the underlying trends in the data, resulting in poor performance on both training and test datasets.

13. Bias: Systematic errors in a model's predictions due to assumptions made during the learning process or due to biased training data.

14. Variance: The amount by which a model's predictions would change if it were trained on a different dataset; high variance can lead to overfitting.

15. Hyperparameter: Configurable parameters that are set before training a machine learning model (e.g., learning rate, batch size) and are not learned from the training data.

16. Confusion Matrix: A table used to evaluate the performance of a classification model by comparing predicted labels with actual labels, providing insight into true positives, false positives, true negatives, and false negatives.

17. Precision: A metric that measures the accuracy of positive predictions made by a classification model, calculated as the ratio of true positives to the sum of true positives and false positives.

18. Recall (Sensitivity): A metric that measures the ability of a classification model to identify all relevant instances, calculated as the ratio of true positives to the sum of true positives and false negatives.

19. F1 Score: The harmonic mean of precision and recall, providing a single score that balances both metrics, particularly useful in imbalanced datasets.

20. Transfer Learning: A technique where a pre-trained model is adapted for a new task, leveraging knowledge gained from one domain to improve performance in another.
  • ❀ 7
Post #1248 1.65K
πŸ’₯ #Cisco Certification Journey Starts Here!
Want to become a certified Network Engineer and boost your IT career in 2026? πŸš€
Whether you're preparing for #CCNA #CCNP or even #CCIE, this is your chance to get premium Cisco learning resources & insider study support!

πŸ”₯ What You’ll Get:
🌐 Cisco Training Roadmaps
🌐 Networking Lab Guides
🌐 Command Cheat Sheets
🌐 Cisco Official eBooks
🌐 Real Practice Questions
🌐 Exam Preparation Tips

🎁 FREE Starter Resources Available:
πŸ”—βœ… CCNA Beginner Notes:bit.ly/3Qo17wQ
πŸ”—βœ… CCNP Study Checklist:https://reurl.cc/R257Ye

πŸ“© To receive all FREE Cisco materials directly in your inbox:
wa.link/cedqoq
πŸ‘‰ Connect us and Leave your email to get instant access!

πŸ’‘ Bonus for subscribers:
https://chat.whatsapp.com/FLth69u2WswIlZ6bta2SJf
βœ” Exclusive study group invitations
βœ” Latest Cisco exam changes
βœ” Fast-track learning strategies
βœ” Priority access to upcoming training sessions

⚑ Thousands of IT learners are already preparing smarter.
Don’t miss your chance to level up your networking career in 2026! πŸš€
Spotoexam Cisco CCNA Course-SPOTOLearning.com SPOTO offers the latest CCNA Training courses to get your Cisco certifications & more. Get Started Now!
  • ❀ 4
  • 😁 1
Post #1247 1.42K

Forwarded from Free Programming Books

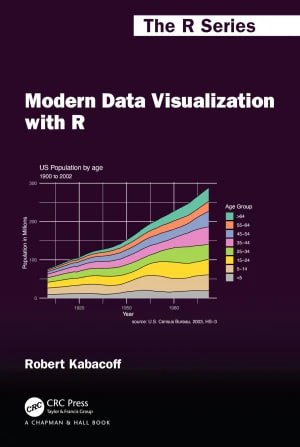
πŸ“˜Modern Data Visualization with R

✍️ Author: Robert Kabacoff

Read Online

#DataVisualization
────────────────────
πŸ‘‰ @free_programming_books_bds πŸ‘ˆ
  • ❀ 4
Post #1246 1.71K
β–Ž9 Misconceptions About Deep Learning

❌ Deep Learning is just about neural networks
βœ… While neural networks are central, deep learning also involves techniques like reinforcement learning, generative models, and unsupervised learning, which can be quite different.

❌ More layers always mean better performance
βœ… Simply adding more layers can lead to overfitting or vanishing gradients. The architecture must be carefully designed to fit the problem rather than just increasing depth.

❌ Deep Learning models learn everything automatically
βœ… Models require careful feature engineering, hyperparameter tuning, and data preprocessing. They don’t magically learn from raw data without human guidance.

❌ Training a model on a powerful GPU guarantees fast results
βœ… Training time depends on many factors, including data complexity and model architecture. A powerful GPU can help, but it doesn't automatically lead to quicker training.

❌ Deep Learning models are always better than traditional ML
βœ… Traditional machine learning methods can outperform deep learning in scenarios with limited data or simpler tasks. The choice of method should depend on the specific context.

❌ Once a model is trained, it doesn’t need further evaluation
βœ… Models can drift over time as real-world data changes. Regular evaluation and updates are essential to ensure they remain accurate and relevant.

❌ Deep Learning can solve any problem
βœ… Some problems are inherently unsolvable with current deep learning techniques, especially those requiring complex reasoning or understanding of context beyond the data.

❌ Hyperparameter tuning is a one-time task
βœ… Hyperparameters can interact in complex ways, and their optimal settings may change as the model evolves or as new data is introduced. Continuous tuning is often necessary.

❌ Deep Learning models are inherently unbiased
βœ… Models can learn biases present in the training data. It's crucial to assess and mitigate bias to avoid unfair or unethical outcomes.
  • ❀ 6
  • πŸ‘ 1
Older posts β†’
Threads Profile ViewerView any public Threads profile without an account.Open ThreadLook β†’Writing with AI? Make it sound human.Metric37 rewrites AI drafts so they read naturally. Free AI detector, 1,500 words free.Try Metric37 β†’