
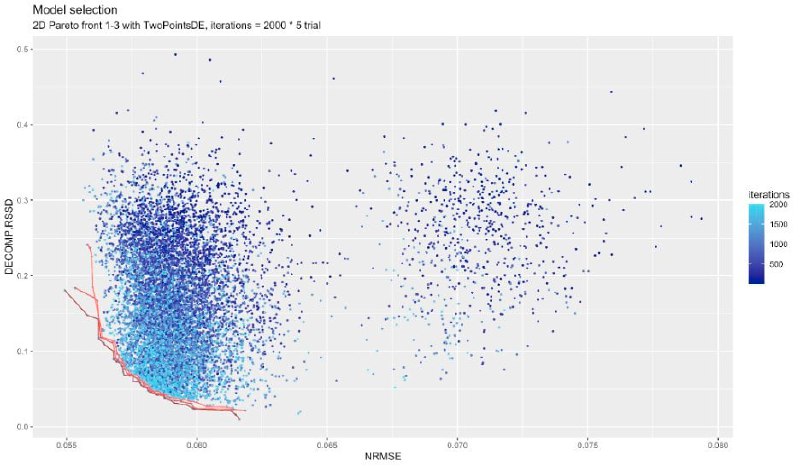
In hindsight, we can see that the resulting model gets closer to the bottom left corner as the number of iterations increases. The line denotes the Pareto front (you cannot improve one objective without worsening the others). The final model is chosen by the user based on the following criteria:
Experimental calibration. It makes sense to integrate the results of the experiments with causal relationships.
Business insights. It is worth comparing against a well-established prior on ROI, adstock, or benchmarks.
ROI distribution estimate for paid channels, ROAS. The narrower and taller the distribution is, the more confident we are in the results.
#ArticleReview
Post #36
1.45K

- 👍 3
- 🔥 3