
📊 BTCAT CHART 📊
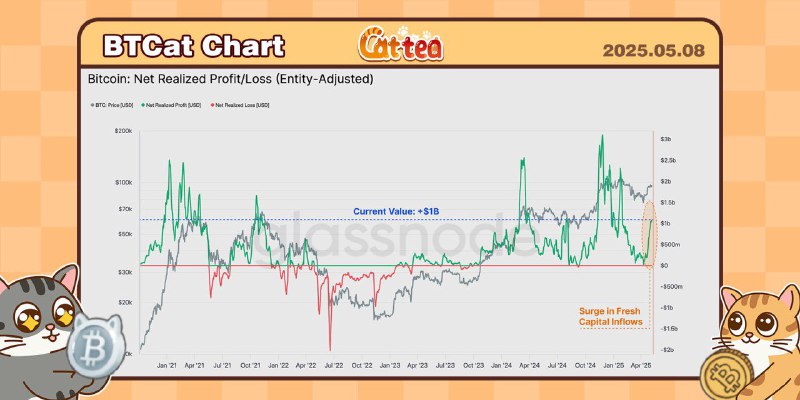
The Net Realized Profit/Loss metric is calculated as the first derivative of the Realized Cap, allowing us to observe the magnitude of net USD denominated capital flows occurring each day.
A surge in profit taking can be observed in recent weeks, with the recent rally drawing in over $1B/day in net capital inflows. This points to initial indicators of a return of demand-side strength, allowing sellers to lock in profits, and speaking to buyers willing to pick up coins at the current market price.
This shows strong buyer interest is soaking up the supply. The continuous flow of new money into the market is a healthy, positive signal.
Every day UTC 11:00AM - Follow BTCAT Chart, no FOMO, no loss! 🚀
#BTCatChart #Bitcoin #TradingInsights #TradingIncoming #Cattea #ToTheMoon
Post #145
249K
- 👍 2.3K
- ❤ 1.1K
- 🔥 487
- 🤣 160
- 🥰 90
- 🐳 88
- 🦄 88
- 🍾 75
- 🤔 72
- 🙈 72
- 👏 69