TGViewer
Channel Public Channel
BitStat

BitStat

@bit_stat_com

Know your edge. Track your trades, analyze your performance, grow as a trader. Forex, futures and spot - automatic sync with MT5, Binance and Bybit.

https://bit-stat.com

BitStat Chat: https://t.me/+mmAZ9gfLrlZhZjNi

Support: @BitStat_Manager
Subscribers
96
Photos
56
Videos
9
Links
42

Showing posts older than #51 · Back to latest

Older Posts 14 shown
Post #48 23
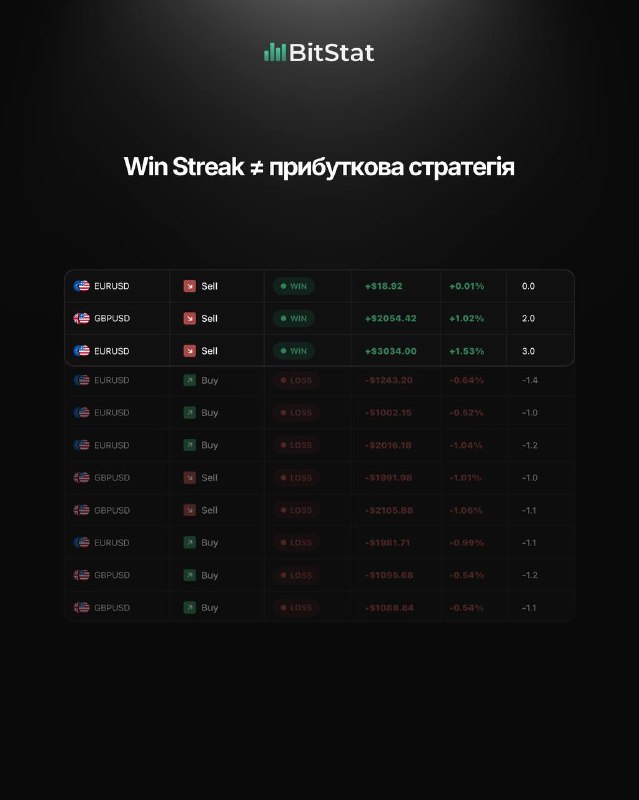
Win Streak може створити ілюзію, що твоя стратегія працює.

3, 5 або навіть 10 прибуткових угод поспіль - це приємно бачити в журналі. Але це ще не доказ того, що твоя система стабільна.

Ти можеш потрапити в сильну серію навіть зі стратегією, яка на довгій дистанції має негативне математичне очікування.

Тому замість того, щоб оцінювати себе за останніми угодами, дивись на всю дистанцію:

• Win Rate - як часто ти закриваєш угоди в плюс
• Average R:R - скільки ти в середньому отримуєш відносно ризику
• Profit Factor - наскільки прибутки перевищують збитки
• Max Drawdown - наскільки глибокими бувають просадки
• Загальний P&L - фінальний результат
• Динаміка рахунку - як змінювався результат протягом усієї історії

Одна серія показує момент.
Статистика показує систему.

Не оцінюй стратегію за кількома останніми угодами. Дивись на те, що вона показує на дистанції.

Аналізуй всю історію своїх угод у BitStat.
  • ❤ 6
  • 🔥 2
Post #47 25
Нове оновлення BitStat - графіки позицій

Тепер замість звичайного скріну можна переглядати свою позицію прямо на графіку.

Бачиш, як розвивалась угода, де був вхід і вихід, та можеш детальніше розібрати кожну позицію.

Менше скріншотів - більше контексту для аналізу.

Спробуй нові графіки вже зараз: bit-stat.com
  • ❤ 8
  • 🔥 1
Post #44 26
Ти справді знаєш, чому втрачаєш гроші?

Після збиткової угоди ми майже завжди знаходимо просте пояснення:
«Поганий вхід»
«Зайшов занадто рано»
«Не дочекався підтвердження»
«Не врахував новини»

Але чи справді це причина?
Одна збиткова угода нічого не пояснює.

Подивись на серію своїх трейдів - і можеш побачити, що збитки концентруються в певному інструменті, стратегії, сесії або типі входу.

Те, що здається випадковістю, може виявитися закономірністю.

Не припускай причину. Перевіряй її даними.
BitStat допомагає знайти ці закономірності та побачити, що насправді впливає на результат твоєї торгівлі.

bit-stat.com
  • ❤ 7
  • 🔥 1
Post #41 31
Кожен може показати одну прибуткову угоду.

+$1,944.
Красивий результат. Красивий скріншот.
Але що було до неї?

Одна угода не покаже:
• скільки ти ризикував
• який був R:R
• яку просадку пережив рахунок
• наскільки стабільна твоя система

Ти можеш показати +$2,000 на одній угоді, але це ще не означає, що ти прибутковий трейдер.
Стабільність видно не в одній угоді, а в серії.

Саме тому важливо дивитися на повну статистику: Win Rate, R:R, Drawdown, Profit Factor та динаміку рахунку.
BitStat допомагає побачити всю картину, а не тільки красивий результат.

bit-stat.com
  • ❤ 7
Post #40 28
A screenshot shows only one moment.

Statistics show the full picture.

BitStat brings your trading history together in one place - from overall performance to every individual trade.

Not just one winning trade.
Not just a single screenshot.
Your complete trading statistics.

Don’t trust screenshots. Trust the data.

bit-stat.com
  • ❤ 8
  • 🔥 1
Post #39 30
Your win rate might be lying to you.

A 70% win rate sounds impressive.
But what if your average winner is only +0.5R, while your average loser is -2R?

You could win 7 out of 10 trades and still lose money.
That’s why win rate should never be analyzed on its own.

R-multiple shows how much you made or lost relative to the risk taken on each trade:
- +1R = gained what you risked
- +3R = gained 3× your initial risk
- -1R = lost your planned risk

And this is where expectancy becomes important.
For example:
40% win rate + 3R average win + 1R average loss = +0.6R expectancy per trade.

Meanwhile:
70% win rate + 0.5R average win + 2R average loss = -0.25R expectancy.
So the trader with the lower win rate can have the much stronger system.

Stop asking only:
“How often am I right?”

Start asking:
“How much do I make when I’m right compared to what I lose when I’m wrong?”

Read the full breakdown:
Why Your Win Rate Lies Without R-Multiple - BitStat

https://bit-stat.com/blog/win-rate-lies-without-r-multiple
  • ❤ 7
  • 🔥 2
Post #38 36
🎥 New BitStat video - Strategies & Setups Overview

In this video, we explore Strategies & Setups in BitStat - a dedicated space for organizing your trading approach and tracking what works best.

You’ll see how to:

• Create and organize trading strategies
• Define market context and entry rules
• Build and track specific trade setups
• Group strategies and setups into folders
• Review performance by trades, Win Rate, P&L, and Risk/Reward
• Link strategies and setups to your trades in the Journal

The goal is simple - turn your trading ideas into a structured system and evaluate every approach with real performance data.

▶️ Watch the full video - https://youtu.be/vXhOO1cr1m8?si=_ZZ8kCrGCLDRuPlK

Try BitStat → http://bit-stat.com
  • ❤ 7
  • 🔥 1
Post #37 31
Why do most traders never receive a payout from prop firms?

The statistics behind prop trading are brutal:

Only ~14% of traders reach the funded stage, while only ~7% of all challenge participants receive a payout.

But the bigger problem is understanding why traders keep losing accounts.

Overtrading. Breaking rules. Poor risk management. Trading the wrong sessions. Focusing on individual trades instead of recurring patterns.

Without proper statistics, these mistakes are easy to miss.

BitStat brings your trading history into one place and shows more than just PnL - win rate, RR, drawdown, performance by day and session, best and worst periods, and more.

Instead of asking, “Why did I fail another challenge?” you can see exactly where your trading is going wrong.

Statistics won’t make you profitable.
But they can show you what you can’t see while trading.

Analyze your trading. Find your edge. Trade with data.

bit-stat.com
  • ❤ 6
  • 👀 2
  • 🔥 1
Post #36 34
🎥 New BitStat video - Journal Overview

In this video, we take a closer look at the BitStat Journal - your complete trading history in one place.

You’ll see how to review, organize, and analyze your trades:

• Trade history and key details
• P&L and performance
• Filters and grouping
• Trading sessions and setups
• Risk / Reward and trade statistics
• Detailed trade review
• Notes and trade charts
• Shareable trade cards

The goal is simple — turn your trading history into clear insights and make better decisions based on real data.

▶️ Watch the full video and explore the BitStat Journal - https://youtu.be/dgbRYWbbR0s?si=aSqxcnoHK0hrjSGh

Try BitStat → http://bit-stat.com
  • ❤ 6
  • 🔥 2
Post #35 35
Full P&L Control

How much did you make this month? What's your average per trade? Is your profit factor above or below 1?

If you need to open Excel to answer - that's a problem.

P&L Analysis in BitStat shows it all at once:
→ Total P&L for today / week / month
→ Best and worst trade
→ Return on winners / losers
→ Profit factor

You trade - BitStat runs the numbers.

bit-stat.com
  • ❤ 6
  • 🔥 2
Post #34 38
🎥 New BitStat video - Dashboard Overview

In this video, we take a closer look at the BitStat Dashboard and its key trading metrics.

You’ll see how to quickly review your trading performance and understand the main numbers behind your results:

• P&L and performance
• Win Rate
• Risk / Reward
• Equity Curve
• Number of trades
• Winning vs. losing trades
• Performance over different periods
• Key account statistics

The goal is simple - see your real trading statistics and stop trading blind.

▶️ Watch the full video and explore the BitStat Dashboard - https://www.youtube.com/watch?v=ZNyxEdVVsxQ

Try it BitStat → http://bit-stat.com
  • ❤ 7
  • 🔥 2
Post #33 32
Trade duration isn’t just a detail. It’s part of your strategy.

Some traders close winning positions too early. Others hold losing trades too long, hoping for a reversal.

Look at your data:

- What is the average duration of your winning trades?
- How long do losing trades last on average?
- Which holding-time range delivers your best average P&L?

If trades held for 4-12 hours produce your best results while short trades consistently lose money, that’s not random. It’s a signal to revisit your entry, trade-management, and exit rules.

Don’t try to hold every trade longer or close everything sooner. Find the duration at which your strategy performs best - then make it a rule.

BitStat helps you uncover this in your trading statistics.

Try it → http://bit-stat.com
  • ❤ 7
  • 🔥 2
Post #32 34
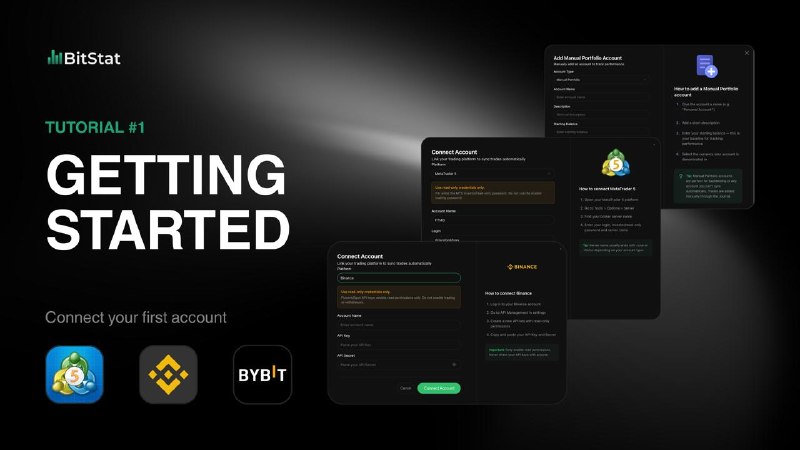
🎥 New video - Getting Started with BitStat

New to BitStat? We’ve prepared a short guide that walks you through the first steps.

In the video, we show you how to:
• create your BitStat account
• connect MT5, Binance or Bybit
• add a Manual Account
• start syncing your trades automatically

From registration to your first trading statistics - everything you need to get started in one video.

▶️ Watch the video and start using BitStat - https://youtu.be/p3ZFSBsaSFo

Try it → http://bit-stat.com
  • ❤ 6
  • 🔥 2
Post #31 33
A strategy can look good. But only data shows whether it actually works.

Track every strategy and setup separately: trade count, win rate, P&L, and average R.
See what to scale, what to improve, and what to remove from your plan.


bit-stat.com
  • ❤ 6
  • 🔥 2
Older posts →
Threads Profile ViewerView any public Threads profile without an account.Open ThreadLook →Writing with AI? Make it sound human.Metric37 rewrites AI drafts so they read naturally. Free AI detector, 1,500 words free.Try Metric37 →