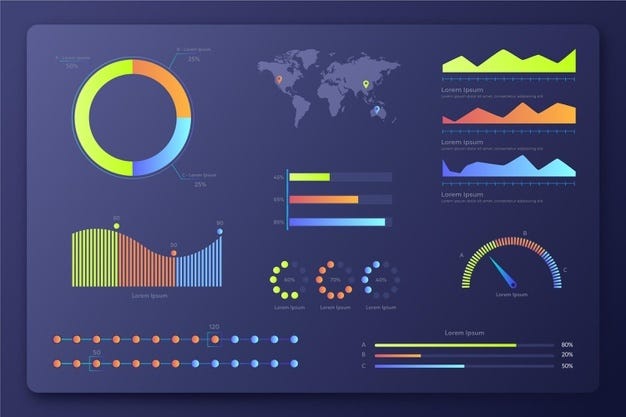
🚀Need a visual dashboard quickly? Try Panel!
Every data analyst knows that the dashboard should summarize the most important indicators for decision makers. On the one hand, the dashboard is a simple HTML page for quickly viewing graphs and text. On the other hand, making it visual and not overloaded is not so easy. Moreover, not every BI specialist has design taste and skills in working with HTML components and their interaction with Javascript. But data specialists actively use Python.
To create the dashboard using only Python you can with Panel - the Python open source library. It allows to create custom interactive web applications and dashboards, widgets that users connect to graphs, images, tables or text. With it, you do not need to know how to create HTML components and their interaction with Javascript, because it is written on Python.
Panel supports almost all plot library builds and works just as well in Jupyter notebooks as it does on a standalone secure web server. The Panel uses the same code, supports both Python and adapts HTML/JavaScript, exports applications and can export applications, and can run rich interactive applications without tying domain-specific code to any possible GUI or web interface tool.
Panel makes easy the following:
• use of Python tools for data analysis and processing:
• development in IDE or laptop environment with further deployment of applications;
• Rapid prototyping of applications and dashboards, several polished templates for final deployment;
• deep interconnection, interaction switching and events on the client side in Python;
• transfer of large and small data to an external interface;
• Authentication in the application using built-in OAuth browsers.
Usage example: https://medium.com/@jairotunior/advanced-interactive-dashboards-in-python-cc2927dcde07
Post #484
688