https://aws.amazon.com/blogs/mt/build-an-observability-solution-using-managed-aws-services-and-the-opentelemetry-standard/
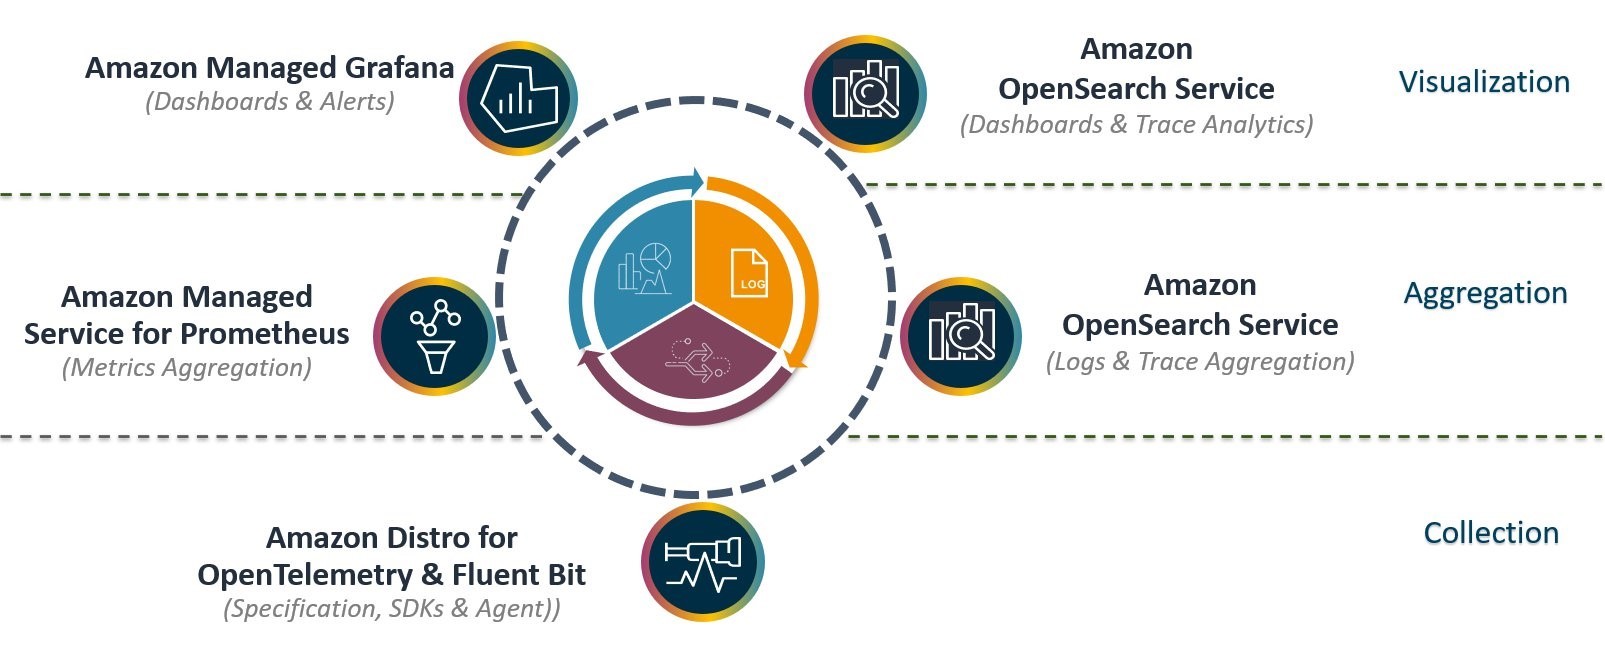
We centralized the metrics, traces, and logs collected from workloads running in various AWS accounts using:▫️
ADOT (AWS Distro for OpenTelemetry)▫️
Amazon Managed Grafana▫️
Amazon Managed Service for Prometheus▫️
Amazon OpenSearch Service.To visualize these metrics, traces, logs, and to show correlation, we setup:▫️
OpenSearch dashboard▫️
Grafana workspace with Amazon Managed Grafana.This provided us with a native integration with Amazon Managed Service for Prometheus.We also leveraged a hub-and-spoke architecture for solution scalability.#observability